Monitor - Prometheus
- Prometheus
Prometheus
几点原则
- 监控是基础设施,目的是为了解决问题,不要只朝着大而全去做,尤其是不必要的指标采集,浪费人力和存储资源(To B商业产品例外)。
- 需要处理的告警才发出来,发出来的告警必须得到处理。
- 简单的架构就是最好的架构,业务系统都挂了,监控也不能挂。Google Sre 里面也说避免使用 Magic 系统,例如机器学习报警阈值、自动修复之类。这一点见仁见智吧,感觉很多公司都在搞智能 AI 运维。
Prometheus 的局限
- Prometheus 是基于 Metric 的监控,不适用于日志(Logs)、事件(Event)、调用链(Tracing)。
- Prometheus 默认是 Pull 模型,合理规划你的网络,尽量不要转发。
- 对于集群化和水平扩展,官方和社区都没有银弹,需要合理选择 Federate、Cortex、Thanos等方案。
- 监控系统一般情况下可用性大于一致性,容忍部分副本数据丢失,保证查询请求成功。这个后面说 Thanos 去重的时候会提到。
- Prometheus 不一定保证数据准确,
- 一是指 rate、histogram_quantile 等函数会做统计和推断,产生一些反直觉的结果,这个后面会详细展开。
- 二来查询范围过长要做降采样,势必会造成数据精度丢失,不过这是时序数据的特点,也是不同于日志系统的地方。
合理选择黄金指标
- 采集的指标有很多,Google 在“Sre Handbook”中提出了“四个黄金信号”:
延迟、流量、错误数、饱和度。- 实际操作中可以使用 Use 或 Red 方法作为指导,
- Use 用于资源,Red 用于服务。
- Use 方法:
Utilization、Saturation、Errors。如 Cadvisor 数据 - Red 方法:
Rate、Errors、Duration。如 Apiserver 性能指标
Prometheus 采集中常见的服务分三种:
在线服务:如 Web 服务、数据库等,一般关心请求速率,延迟和错误率即 RED 方法。
离线服务:如日志处理、消息队列等,一般关注队列数量、进行中的数量,处理速度以及发生的错误即 Use 方法。
批处理任务:和离线任务很像,但是离线任务是长期运行的,批处理任务是按计划运行的,如持续集成就是批处理任务,对应 K8S 中的 job 或 cronjob, 一般关注所花的时间、错误数等,因为运行周期短,很可能还没采集到就运行结束了,所以一般使用 Pushgateway,改拉为推。
对Use 和 Red 的实际示例可以参考容器监控实践—K8S常用指标分析这篇文章。
- 容器监控实践—K8S常用指标分析:https://www.xuyasong.com/?P=1717
basic
Prometheus是一个开源监控系统.
- Prometheus是由SoundCloud开发的开源监控报警系统和时序列数据库(TSDB).
- Prometheus使用Go语言开发,是Google BorgMon监控系统的开源版本.
- Prometheus也是以重时序数据库.
Prometheus 生态是一款优秀的开源监控解决方案,其中包括如下组件
- Prometheus server
- 服务端,用来存储时间序列数据.
- 通过配置各个采集任务,采集各个 expoter 或 pushgateway 数据,保存到其内部的时间序列数据库 (TSDB) 中。
- 并根据规则对采集到的数据指标进行计算或重新保存为新的数据指标,判断是否达到阈值并向 Alertmanager 推送告警信息.
- Alertmanager
- 用来处理告警.
- 接收 Prometheus 推送过来的告警信息,通过告警路由,向集成的组件 / 工具发送告警信息.
- 各种 Exporter
- 收集系统或进程信息,转换为 Prometheus 可以识别的数据指标,以 http 或 https 服务的方式暴露给 Prometheus.
- 用来监控 HAProxy,StatsD,Graphite 等特殊的监控目标,并向 Prometheus 提供标准格式的监控样本数据.
- Pushgateway
- 收集系统或进程信息,转换为 Prometheus 可以识别的数据指标,向 Prometheus 推送数据指标.
Prometheus 的优势
- 由指标名称和和键/值对标签标识的时间序列数据组成的多维数据模型.
- 强大的查询语言 PromQL.
- 不依赖分布式存储;单个服务节点具有自治能力.
- 时间序列数据是服务端通过 HTTP 协议主动拉取获得的.
- 也可以通过中间网关来推送时间序列数据.
- 可以通过静态配置文件或服务发现来获取监控目标.
- 支持多种类型的图表和仪表盘.
few key points
- Metric Collection:
- Prometheus uses the pull model to retrieve metrics over HTTP. There is an option to push metrics to Prometheus using Pushgateway for use cases where Prometheus cannot Scrape the metrics. One such example is collecting custom metrics from short-lived kubernetes jobs & Cronjobs
- Metric Endpoint:
- The systems that you want to monitor using Prometheus should expose the metrics on an /metrics endpoint. Prometheus uses this endpoint to pull the metrics in regular intervals.
- PromQL:
- Prometheus comes with PromQL, a very flexible query language that can be used to query the metrics in the Prometheus dashboard. Also, the PromQL query will be used by Prometheus UI and Grafana to visualize metrics.
- Prometheus Exporters:
- Exporters are libraries that convert existing metrics from third-party apps to Prometheus metrics format. There are many official and community Prometheus exporters. One example is, the Prometheus node exporter. It exposes all Linux system-level metrics in Prometheus format.
- TSDB (time-series database):
- Prometheus uses TSDB for storing all the data efficiently.
- By default, all the data gets stored locally.
- However, to avoid a single point of failure, there are options to integrate remote storage for Prometheus TSDB.

Overview
1
2
3
4
5
6
7
8
9
10
11
12
13
14
15
16
17
18
19
20
21
22
23
24
25
26
27
28
29
30
31
32
33
34
35
36
37
38
39
40
41
42
43
44
45
46
47
48
49
50
51
52
53
54
55
56
57
58
59
60
61
62
63
64
65
66
67
68
69
70
71
72
73
74
75
76
77
78
79
80
81
82
83
84
85
86
87
88
89
90
91
92
93
94
95
96
97
98
99
100
101
102
103
104
105
106
107
108
109
110
111
112
113
114
115
116
117
118
119
120
121
122
// # state custom metric
import github.com/prometheus/client_golang/prometheus
cpuTemp = prometheus.NewGauge(
  prometheus.GaugeOpts{
    Name: "cpu_temperature_celsius",
    Help: "Current temperature of the CPU.",}
)
hdFailures = prometheus.NewCounterVec(
  prometheus.CounterOpts{
    Name: "hd_errors_total",
    Help: "Number of hard-disk errors.",
  },
  []string{"device"},
)
totalScrapes= prometheus.NewCounter(
  prometheus.CounterOpts{
    Namespace: namespace,
    Name:      "exporter_scrapes_total",
    Help:      "Current total redis scrapes.",}
)

// # registry custom metric
func init() {
    // Metrics have to be registered to be exposed:
    prometheus.MustRegister(cpuTemp)
    prometheus.MustRegister(hdFailures)
}


// # add custom metric to new port

// # add new port in prometheus py
func main() {

	cpuTemp.Set(65.3)
	hdFailures.With(prometheus.Labels{"device": "/dev/sda"}).Inc()

	prometheus.MustRegister(
		qzPro.CommonCounter, qzPro.FuncCounter, qzPro.VecCounter,
	)
	http.HandleFunc("/common_counter", qzPro.DealCommCounter)
	http.HandleFunc("/vec_counter", qzPro.DealVecCounter)

	# // The Handler function provides a default handler to expose metrics
	# // via an HTTP server. "/metrics" is the usual endpoint for that.
	http.Handle("/metrics", promhttp.Handler()) // 暴露 metrics 指标
	http.Handle("/service", phm.WrapHandler("myhandler", myHandler))
	http.ListenAndServe(":8090", nil)
}


// # create dockerfile
run app
run prometheus with port


// # build img from dockerfile
export $MYAPP="my_app"
export $MYTAG="my_tag"
export $CONTAINERNAME="my_container"
docker build --platform linux/amd64 -f $MYAPP/Dockerfile  . -t $MYTAG
docker tag $MYTAG

// # Local run container from img
docker run \
    --env AWS_ACCESS_KEY_ID \
    --env AWS_SECRET_ACCESS_KEY \
    --env AWS_SESSION_TOKEN \
    --env AWS_DEFAULT_REGION=us-west-2 \
    $MYAPP:$MYTAG

docker run -d -p 9090:9090 \
	-v `pwd`/prometheus-demo.yml:/etc/prometheus/prometheus.yml \
	--name prometheus prom/prometheus


// # check current prometheus config
kubectl get configmap prometheus-server-config \
    -n $CONTAINERNAME \
    -o jsonpath='{.data.prometheus\.yml}' \
    > $MYAPP/prometheus-current.yml


// # add custom metric collection to new port

    - job_name: kubernetes-pod-test
      bearer_token_file: /var/run/secrets/kubernetes.io/serviceaccount/token
      kubernetes_sd_configs:
      - role: pod
      relabel_configs:
      - action: labelmap
        regex: __meta_kubernetes_node_label_(.+)
      - replacement: kubernetes.default.svc:443
        target_label: __address__
      - regex: (.+)
        replacement: /api/v1/nodes/$1/proxy/metrics
        source_labels:
        - __meta_kubernetes_node_name
        target_label: __metrics_path__
      scheme: https
      tls_config:
        ca_file: /var/run/secrets/kubernetes.io/serviceaccount/ca.crt
        insecure_skip_verify: true


// # update prometheus
// # - update k8s yaml file -> rebuild container IaC
// # - directly update prometheus.yml -> restart the container
// # - directly update prometheus extra-config
kubectl patch configmap prometheus-extra-config \
    -n $CONTAINERNAME \
    --patch "$(cat $MYAPP/patch2.yaml)"


// # go to prometheus dashboard
https://127.0.0.1:9090
https://127.0.0.1:9090/targets?search=
https://127.0.0.1:9090/metric
https://127.0.0.1:8089/metric
Concepts
Prometheus: 监控与告警
1:概要介绍

Prometheus是开源的监控告警的解决方案
- 最早由SoundCloud公司所开发和开源,
- 从2012年产生至今已经7年,在技术不断变化的时代这已经是一个很长的时间了,在过去的7年里,Prometheus也得到了越来越多用户的使用和推崇,并且在2016年加入CNCF后,成为继Kubernetes之后最早从中毕业的项目。
- Prometheus的开发语言以Go为主
- 同样在CNCF的landcape的同一领域的还有Grafana、Sensu、graphite、Zabbix等。
- 适合的场景
- 非常适合纯数字类型的时序列数据,无论是以机器为中心的监控场景,还是高度动态变化的面向服务架构下的监控场景,Prometheus都是非常适合的。在微服务的世界中,Prometheus对多维度数据收集和查询的支持能力,是其长袖善舞之处。
- Prometheus被设计用来支撑可靠性,当系统出现问题时能够快速判断故障原因,因此,每个Prometheus服务器都是独立的,不会依赖于网络存储或者其他远程的服务。当你其他的基础设施出现问题的时候,它还是独立可用的,而且不需要昂贵的基础设施的支撑才能够使用。
- 不适合的场景
- Prometheus看重的是可靠性而不是精确性,使用Prometheus,无论什么样的故障境况下,用户总是能够看到可以看到的统计信息,这部分信息往往来源于独立运行的没有发生故障的那些Prometheus服务器所提供。
- 但是如果使用者需要100%的精确,比如实时的交易系统的每次请求的完整性与精确性的场景下,Prometheus可能就无法很好与完整地收集到所有的数据,这种系统或者场景之下,可以选取其他技术用于保证这些数据的完整性与精确性,而Prometheus则可以用来进行监控。
主要特性
- 多维度数据模型: 可使用指标名称和键/值对结合进行数据的管理。
- 提供灵活的查询语言PromQL,利用PromQL能更好地为数据先可视化显示或者告警功能提供更好的数据。
- 不依赖于分布式存储,单个服务节点的数据是自主的,可独立使用。
- 时序列数据库可基于HTTP协议使用PULL模式拉取数据。
- 提供中间网关的方式,也支持向中间网关以PUSH模式推送数据,而Prometheus再从中间网关拉取数据。
- 可以通过服务发现或者静态配置的方式发现目标对象。
- 支持多种方式的图表和仪表盘展示,比如对Grafana的支持。
整体架构
整体架构如下图所示
可以看到,Prometheus的构成非常清晰,主要由如下几个部分构成:
- Pushgateway: 支持时序列数据使用PUSH模式推送的中间网关
- Prometheus Server: 提供PromQL查询语言能力、负责数据的采集和存储等主要功能
- Alertmanager: 是一个独立的组件,提供灵活的报警方式,比如Email、webhook等。
- Web UI: Prometheus本身提供一个非常简单的Web UI界面,这也是其代码中由小比例的JavaScript和TypeScript的原因。当然也可以结合Grafana进行监控数据的可视化展示。
2:安装方法
安装方式
Prometheus支持多种安装方式,比如:
1
2
3
4
5
6
7
8
9
10
11
12
13
14
15
16
17
18
19
20
21
22
23
24
25
26
27
28
29
30
31
32
33
34
35
36
37
38
# 1. Docker镜像方式
# 最简单的方式莫过于直接使用Prometheus提供的官方镜像,
# 使用如下执行命令即可在本地9090端口启动Prometheus服务。
docker run --name prometheus -d -p 127.0.0.1:9090:9090 prom/prometheus

# 2. 二进制文件方式
# 下载预先编译好的二进制文件然后进行安装和设置,下载地址可以是:
# - https://prometheus.io/download/
# - https://github.com/prometheus/prometheus/releases
# 启动方法
# - 解压操作系统相对应的二进制文件包,提供本地设定文件,
# - 使用如下命令即可启动Prometheus服务了
./prometheus --config.file=prometheus.yml

# 3. 源码编译方式
# 构建
# - Prometheus使用go语言开发,所以本地只需要提供go的开发环境
# - 然后git clone源码之后执行make即可构建出二进制文件
mkdir -p $GOPATH/src/github.com/prometheus
cd $GOPATH/src/github.com/prometheus
git clone https://github.com/prometheus/prometheus.git
cd prometheus
make build
# 启动服务
./prometheus --config.file=prometheus.yml


# 4. 其他安装方式
Ansible
* https://github.com/cloudalchemy/ansible-prometheus
Chef
* https://github.com/elijah/chef-prometheus
Puppet
* https://forge.puppet.com/puppet/prometheus
SaltStack
* https://github.com/saltstack-formulas/prometheus-formula
Helm
* 直接使用helm install进行安装,需要注意的是相关版本的Chart是对于Helm 2还是Helm 3的支持。
安装示例
整体来说Prometheus的安装就是一个二进制文件,下载、解压并设定权限,然后通过config.file指定配置文件即可完成安装并启动服务
各种方式基本上都是简化这一原本就很简单的过程而已。
这里以Docker方式的服务启动为例进行说明:
配置文件准备
1
2
3
4
5
6
7
8
9
10
11
# prometheus-demo.yml
global:
  scrape_interval: 10s
  evaluation_interval: 10s

scrape_configs:
  - job_name: "prometheus"
    static_configs:
      - targets: ["127.0.0.1:9090"]
        labels:
          group: "prometheus"
1
2
3
4
5
6
7
8
9
10
11
12
13
14
15
16
17
18
19
# 下载最新版本的Prometheus镜像
docker pull prom/prometheus

# 启动Prometheus服务
# 把配置文件放在本地 ~/docker/prometheus/prometheus.yml,这样可以方便编辑和查看
# 通过 -v 参数将本地的配置文件挂载到 /etc/prometheus/ 位置,这是 prometheus 在容器中默认加载的配置文件位置。
# 如果不确定默认的配置文件在哪,可以先执行上面的不带 -v 参数的命令,然后通过 docker inspect 命名看看容器在运行时默认的参数有哪些(下面的 Args 参数):
docker run -d -p 9090:9090 \
	-v `pwd`/prometheus-demo.yml:/etc/prometheus/prometheus.yml \
	--name prometheus prom/prometheus


docker run -p 9090:9090 \
  --network=host \
  -v `pwd`/prometheus.yml:/etc/prometheus/prometheus.yml \
  prom/prometheus


docker container start prometheus
结果确认
通过https://localhost:9090 访问启动起来的Prometheus的UI界面,缺省进入的是Grap标签的所在页面:
Alerts标签界面信息
Status标签界面信息
Prometheus使用REACT重新改造了界面的显示,可以通过点 击Try experimental React UI进行体验
确认metrics内容 https://localhost:9090/metrics
稍微运行一会,选择一个指标,调节时间范围为15分钟,即可 看到指标的变化情况
3:指标监控示例
事前准备
- Prometheus可以对各种指标数据进行监控,
首先准备用于提供监控数据的应用程序。
1
git clone https://github.com/prometheus/client_golang.git
启动Docker容器进行编译
- 启动Docker并将待编译的工程进行卷的映射
1
2
3
4
5
6
7
8
9
10
11
12
13
14
15
16
17
18
19
20
21
22
23
24
25
26
27
28
29
30
31
32
33
34
35
36
37
38
39
40
# Automatically remove the container when it exits
# The -it instructs Docker to allocate a pseudo-TTY connected to the container’s stdin; creating an interactive bash shell in the container.
# Bind mount a volume
# CPU shares (relative weight)
docker run --rm -it \
	-v `pwd`/client_golang:/go/src liumiaocn/golang:1.13.5-alpine3.11 sh \
	-c 'cd /go/src/examples/random && go get -d && go build && ls -l random'

docker run --rm -it \
	-v `pwd`/client_golang:/go/src golang:1.13.5-alpine3.11 sh \
	-c 'cd /go/src/examples/random && go get -d && go build && ls -l random'
# go: downloading github.com/prometheus/common v0.7.0
# go: downloading github.com/prometheus/client_model v0.1.0
# go: extracting github.com/prometheus/client_model v0.1.0
# go: downloading github.com/golang/protobuf v1.3.2
# go: extracting github.com/prometheus/common v0.7.0
# go: downloading github.com/matttproud/golang_protobuf_extensions v1.0.1
# go: downloading golang.org/x/sys v0.0.0-20191220142924-d4481acd189f
# go: downloading github.com/cespare/xxhash/v2 v2.1.1
# go: downloading github.com/prometheus/procfs v0.0.8
# go: downloading github.com/beorn7/perks v1.0.1
# go: extracting github.com/golang/protobuf v1.3.2
# go: extracting github.com/cespare/xxhash/v2 v2.1.1
# go: extracting github.com/matttproud/golang_protobuf_extensions v1.0.1
# go: extracting github.com/beorn7/perks v1.0.1
# go: extracting github.com/prometheus/procfs v0.0.8
# go: extracting golang.org/x/sys v0.0.0-20191220142924-d4481acd189f
# go: finding github.com/prometheus/client_model v0.1.0
# go: finding github.com/prometheus/common v0.7.0
# go: finding github.com/beorn7/perks v1.0.1
# go: finding github.com/cespare/xxhash/v2 v2.1.1
# go: finding github.com/golang/protobuf v1.3.2
# go: finding github.com/prometheus/procfs v0.0.8
# go: finding github.com/matttproud/golang_protobuf_extensions v1.0.1
# github.com/prometheus/procfs/internal/util
# /go/pkg/mod/github.com/prometheus/procfs@v0.8.0/internal/util/parse.go:69:15: undefined: os.ReadFile
# /go/pkg/mod/github.com/prometheus/procfs@v0.8.0/internal/util/parse.go:78:15: undefined: os.ReadFile
# /go/pkg/mod/github.com/prometheus/procfs@v0.8.0/internal/util/readfile.go:36:9: undefined: io.ReadAll
# note: module requires Go 1.17
配置Prometheus
将Prometheus进行如下配置:
- 在8080-8082三个端口都提供了可供Prometheus进行监控指标数据,
配置说明:
- 设定job名称为example-random
- 数据的抓取时间间隔设定为5秒
- 将8080-8082三个监控对象分成两组,
- 8080和8081一组,组标签名称为production,
- 8082为一组,组标签名称为canary
- ip(192.168.31.242)请修改为自己的IP,因为本文启动的内容均在容器之中,又没有使用link或者其他方式来使得各个容器之间的相互联通,这里直接使用IP方式使得Prometheus能够访问到这些对象机器。
1
2
3
4
5
6
7
8
9
10
11
12
13
14
15
16
17
18
19
20
21
22
23
24
25
26
27
28
29
# prometheus-random.yml
global:
  scrape_interval:     15s # By default, scrape targets every 15 seconds.
  # Attach these labels to any time series or alerts when communicating with
  # external systems (federation, remote storage, Alertmanager).
  external_labels:
    monitor: 'codelab-monitor'

# A scrape configuration containing exactly one endpoint to scrape:
# Here it's Prometheus itself.
scrape_configs:
  # The job name is added as a label `job=<job_name>` to any timeseries scraped from this config.
- job_name: "go-test"
  scrape_interval: 60s
  scrape_timeout: 60s
  metrics_path: "/metrics"
  static_configs:
  - targets: ["localhost:8888"]

  - job_name: "example-random"
    # Override the global default and scrape targets from this job every 5 seconds.
    scrape_interval: 5s
    static_configs:
      - targets: ["192.168.31.242:8080", "192.168.31.242:8081"]
        labels:
          group: "production"
      - targets: ["192.168.31.242:8082"]
        labels:
          group: "canary"
可以看到配置文件中指定了一个job_name
- 所要监控的任务即视为一个job
- scrape_interval, scrape_timeout 是pro进行数据采集的时间间隔和频率,
- metrics_path 指定了访问数据的http路径,
- target 是目标的ip:port,这里使用的是同一台主机上的8888端口。
- [“localhost:8888”]
- or [“xx.xx.xx.xx:8888”]
启动 Prometheus服务
配置好之后就可以启动 or 重启 Prometheus服务 了
1
2
3
4
5
6
7
8
9
10
11
12
13
14
15
16
# 使用如下命令启动Prometheus服务
docker run -d -p 9090:9090 \
	-v `pwd`/prometheus-demo.yml:/etc/prometheus/prometheus.yml \
	--name prometheus prom/prometheus

docker run -d -p 9090:9090 \
	-v `pwd`/prometheus-random.yml:/etc/prometheus/prometheus.yml \
	--name prometheus prom/prometheus

docker run --network=host -p 9090:9090 \
  -v `pwd`/prometheus.yml:/etc/prometheus/prometheus.yml \
  prom/prometheus

# 确认Promtheus容器状态
docker ps |grep prometheus
# 1f9d3831c1d2        prom/prometheus     "/bin/prometheus --c…"   About a minute ago   Up 59 seconds       0.0.0.0:9090->9090/tcp   prometheus
此处网络通信采用的是host模式
- 所以docker中的pro可以直接通过localhost来指定同一台主机上所监控的程序。
- prob暴露9090端口进行界面显示或其他操作,需要对docker中9090端口进行映射。
- 启动之后可以访问web页面https://localhost:9090/graph,在status下拉菜单中可以看到配置文件和目标的状态
- 此时目标状态为DOWN,因为所需要监控的服务还没有启动起来

步入正文,用pro golang client来实现程序吧。
pro golang client
1
2
3
4
5
6
7
8
9
10
11
12
13
metrics name {(label)key-value} float64 value

# HELP go_gc_duration_seconds A summary of the GC invocation durations.
# TYPE go_gc_duration_seconds summary
go_gc_duration_seconds{quantile="0.5"} 0.000107458
go_gc_duration_seconds{quantile="0.75"} 0.000200112
go_gc_duration_seconds{quantile="1"} 0.000299278
go_gc_duration_seconds_sum 0.002341738
go_gc_duration_seconds_count 18

# HELP go_goroutines Number of goroutines that currently exist.
# TYPE go_goroutines gauge
go_goroutines 107
A Basic Example 演示了使用这些数据类型的方法(注意将其中8080端口改为本文的8888)
其中创建了一个 gauge 和 CounterVec 对象,并分别指定了 metric name 和 help 信息
- 其中 CounterVec 是用来管理相同 metric 下不同 label 的一组 Counter
- 代码中声明了一个lable的key为
device - 使用的时候也需要指定一个 label
hdFailures.With(prometheus.Labels{"device":"/dev/sda"}).Inc()
- 代码中声明了一个lable的key为
同理存在GaugeVec,
- 变量定义后进行注册
- 最后再开启一个http服务的8888端口就完成了整个程序
- pro采集数据是通过定期请求该服务http端口来实现的。
1
2
3
4
5
6
7
8
9
10
11
12
13
14
15
16
17
18
19
20
21
22
23
24
25
26
27
28
29
30
31
32
33
34
35
36
37
38
39
package main

import (
	"log"
	"net/http"

	"github.com/prometheus/client_golang/prometheus"
	"github.com/prometheus/client_golang/prometheus/promhttp"
)

var (
	cpuTemp = prometheus.NewGauge(prometheus.GaugeOpts{
		Name: "cpu_temperature_celsius",
		Help: "Current temperature of the CPU.",
	})
	hdFailures = prometheus.NewCounterVec(
		prometheus.CounterOpts{
			Name: "hd_errors_total",
			Help: "Number of hard-disk errors.",
		},
		[]string{"device"},
	)
)

func init() {
	// Metrics have to be registered to be exposed:
	prometheus.MustRegister(cpuTemp)
	prometheus.MustRegister(hdFailures)
}

func main() {
	cpuTemp.Set(65.3)
	hdFailures.With(prometheus.Labels{"device":"/dev/sda"}).Inc()

	// The Handler function provides a default handler to expose metrics
	// via an HTTP server. "/metrics" is the usual endpoint for that.
	http.Handle("/metrics", promhttp.Handler())
	log.Fatal(http.ListenAndServe(":8888", nil))
}
启动程序之后可以在web浏览器里输入https://localhost:8888/metrics 就可以得到client暴露的数据
- 其中有片段显示为:
1
2
3
4
5
6
7
# HELP cpu_temperature_celsius Current temperature of the CPU.
# TYPE cpu_temperature_celsius gauge
cpu_temperature_celsius 65.3

# HELP hd_errors_total Number of hard-disk errors.
# TYPE hd_errors_total counter
hd_errors_total{device="/dev/sda"} 1
- 上图就是示例程序所暴露出来的数据
- 并且可以看到counterVec是有label的
- 而单纯的gauage对象却不用lable标识,
- 这就是基本数据类型和对应Vec版本的差别。
- 此时再查看https://localhost:9090/graph 就会发现服务状态已经变为UP了。

上面的例子只是一个简单的demo0
- 因为在prometheus.yml配置文件中指定采集服务器信息的时间间隔为60s
- 每隔60s pro会通过http请求一次自己暴露的数据
- 而在代码中只设置了一次gauge变量cupTemp的值
- 如果在60s的采样间隔里将该值设置多次,前面的值就会被覆盖,只有pro采集数据那一刻的值能被看到
- 并且如果不再改变这个值,pro就始终能看到这个恒定的变量,除非用户显式通过Delete函数删除这个变量。
- 使用Counter,Gauage等这些结构比较简单,但是如果不再使用这些变量需要手动删,可以调用resetfunction来清除之前的metrics。
启动监控对象进程
- 分别在8080-8082三个端口启动三个服务用于提供Prometheus监控的对象进程。
1
2
3
4
5
6
7
8
9
10
11
12
13
14
15
16
17
docker run -p 8080:8080 -d -it \
	-v `pwd`/random:/random \
	--rm alpine /random \
	-listen-address=:8080
# 22da3e4803b8fc7b31b0ebb7b8eac0afc188c62bfc1e1ae58f26ebf56178f3b8

docker run -p 8081:8081 -d -it \
	-v `pwd`/random:/random \
	--rm alpine /random \
	-listen-address=:8081
# ed35547ffb865df313236adab20d0c20164f051a45df9f59c93df6e1ddaec4b6

docker run -p 8082:8082 -d -it \
	-v `pwd`/random:/random \
	--rm alpine /random \
	-listen-address=:8082
# 4e7da2844b26b67b41ad43b52673fccb95d7631c88906d3dff1f244dff62a43e
结果确认:容器状态确认
1
2
3
4
5
docker ps
# CONTAINER ID        IMAGE               COMMAND                  CREATED             STATUS              PORTS                    NAMES
# 4e7da2844b26        alpine              "/random -listen-add…"   2 seconds ago       Up 1 second         0.0.0.0:8082->8082/tcp   ecstatic_hypatia
# ed35547ffb86        alpine              "/random -listen-add…"   10 seconds ago      Up 9 seconds        0.0.0.0:8081->8081/tcp   blissful_jennings
# 22da3e4803b8        alpine              "/random -listen-add…"   21 seconds ago      Up 20 seconds       0.0.0.0:8080->8080/tcp   nervous_bell
结果确认:指标确认
1
2
3
4
5
6
7
8
curl https://localhost:8080/metrics 2>/dev/null |wc -l
#  164

curl https://localhost:8081/metrics 2>/dev/null |wc -l
#  164

curl https://localhost:8082/metrics 2>/dev/null |wc -l
#  164
结果确认
确认连接状态
Prometheus从8080-8082的端口获取监控数据,而这些连接是否正常,可以从如下界面进行确认
获取的指标信息
查看某一指标的实时状况
Prometheus也具有一点可视化的能力,比如可以直接确认选中的某项指标的一定时间段(缺省1个小时,这里选择为5分钟)的变化情况
4:使用Grafana进行可视化显示
事前准备
- 这里仍然使用前文所创建的random进程提供的指标数据信息,详细设定过程可参看:link
Grafana准备
- Grafana从2015年10发布的2.5.0版本开始支持对对Prometheus数据源,在本文的示例中将使用6.5.1版本进行可视化显示的演示。
1
2
3
4
5
6
# 拉取镜像
docker pull grafana/grafana:6.5.1

# 启动Grafana服务
docker run -d -p 3000:3000 \
	--name grafana grafana/grafana:6.5.1
设定Prometheus数据源
- 启动Grafana和Prometheus之后,使用如下步骤即可在Grafana中添加Prometheus的数据源。
1
2
3
4
5
6
7
8
9
10
11
12
13
14
15
16
17
18
19
20
21
22
23
24
25
26
27
28
29
30
31
32
33
34
35
36
37
38
39
40
41
42
43
44
45
46
47
48
49
50
51
52
53
54
55
56
57
58
59
60
61
62
63
64
65
66
67
68
69
70
71
72
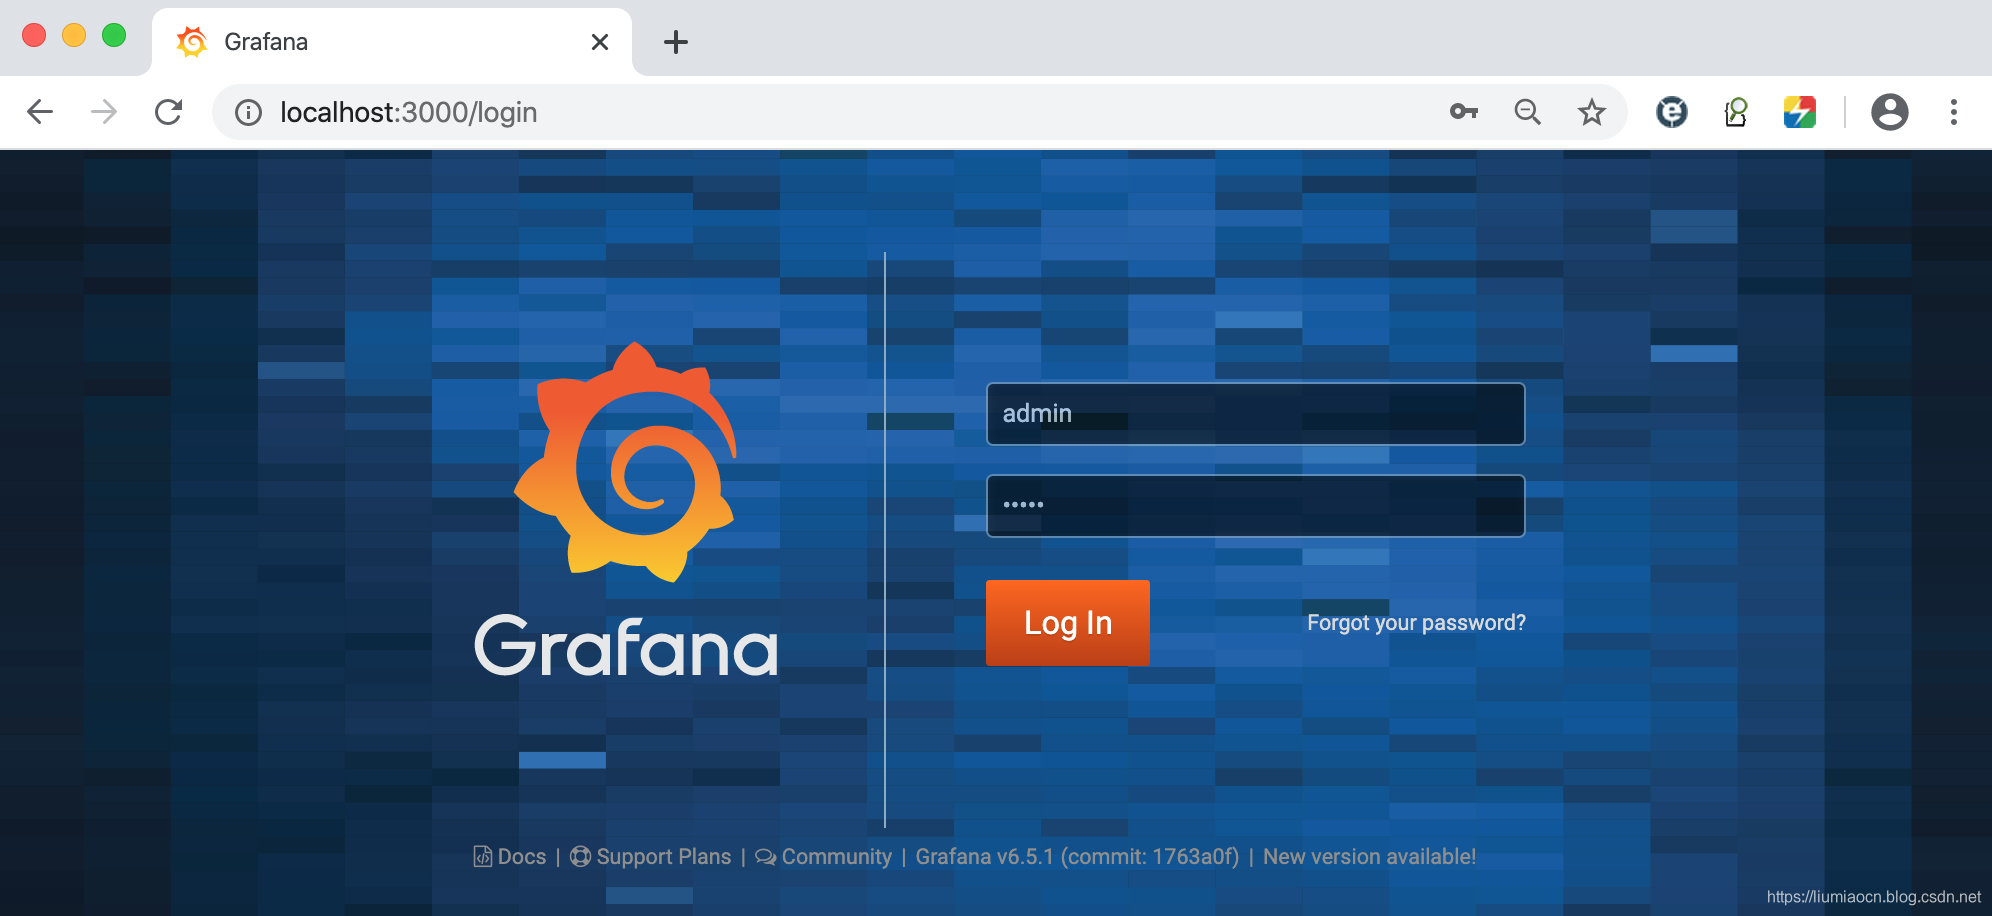
步骤1: 登录Grafana
- 使用缺省的admin/admin账号登录Grafana,
- 登录之后可以修改缺省密码也可直接跳过 passwd
<!--  -->
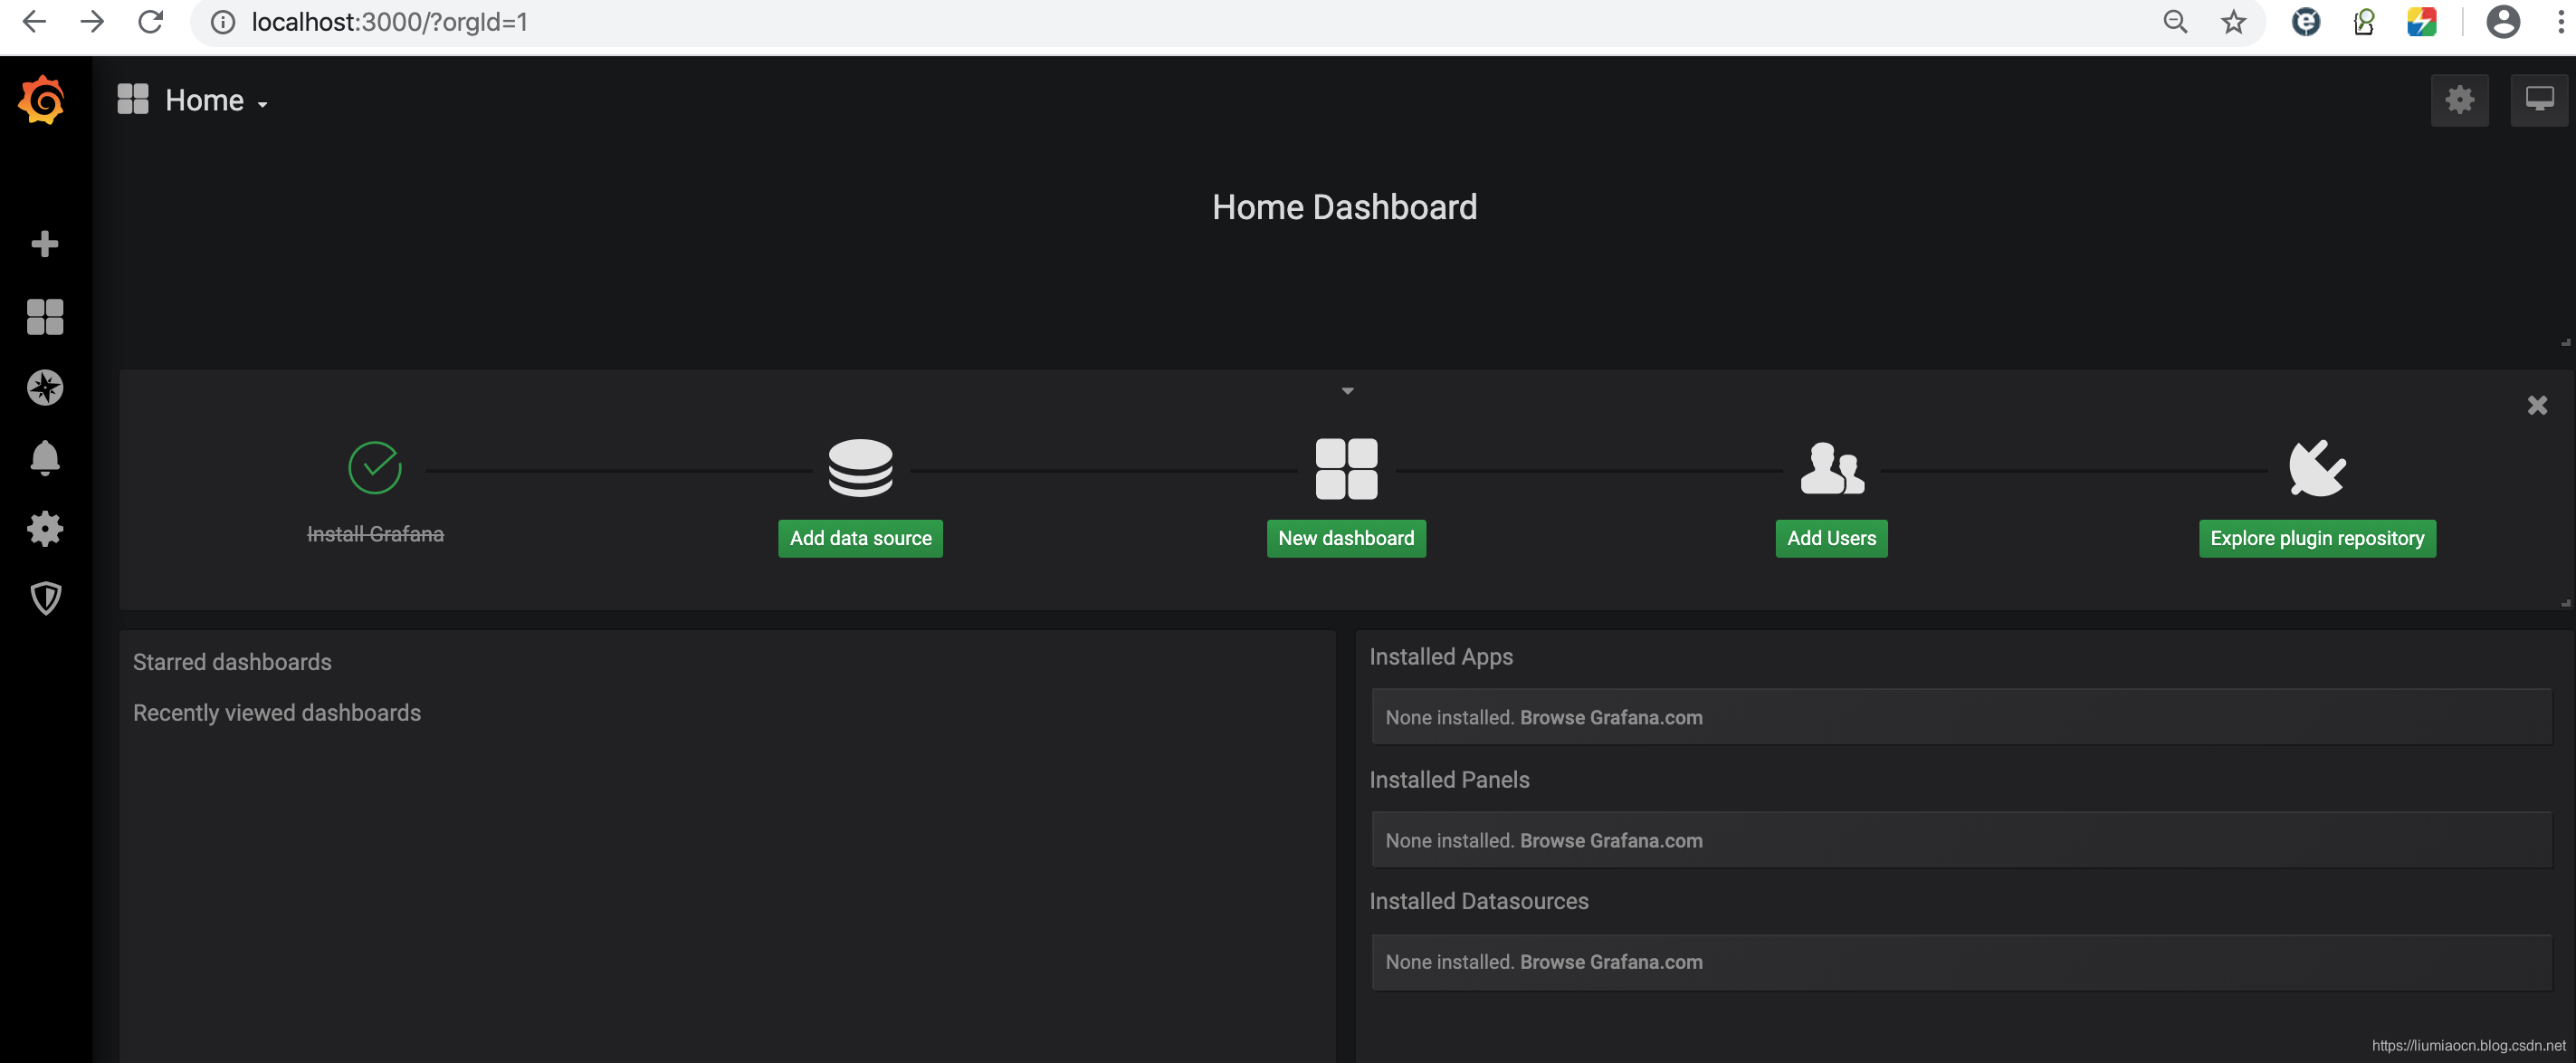
步骤2: 添加Prometheus数据源
- 点击 Add data source进行数据源的添加
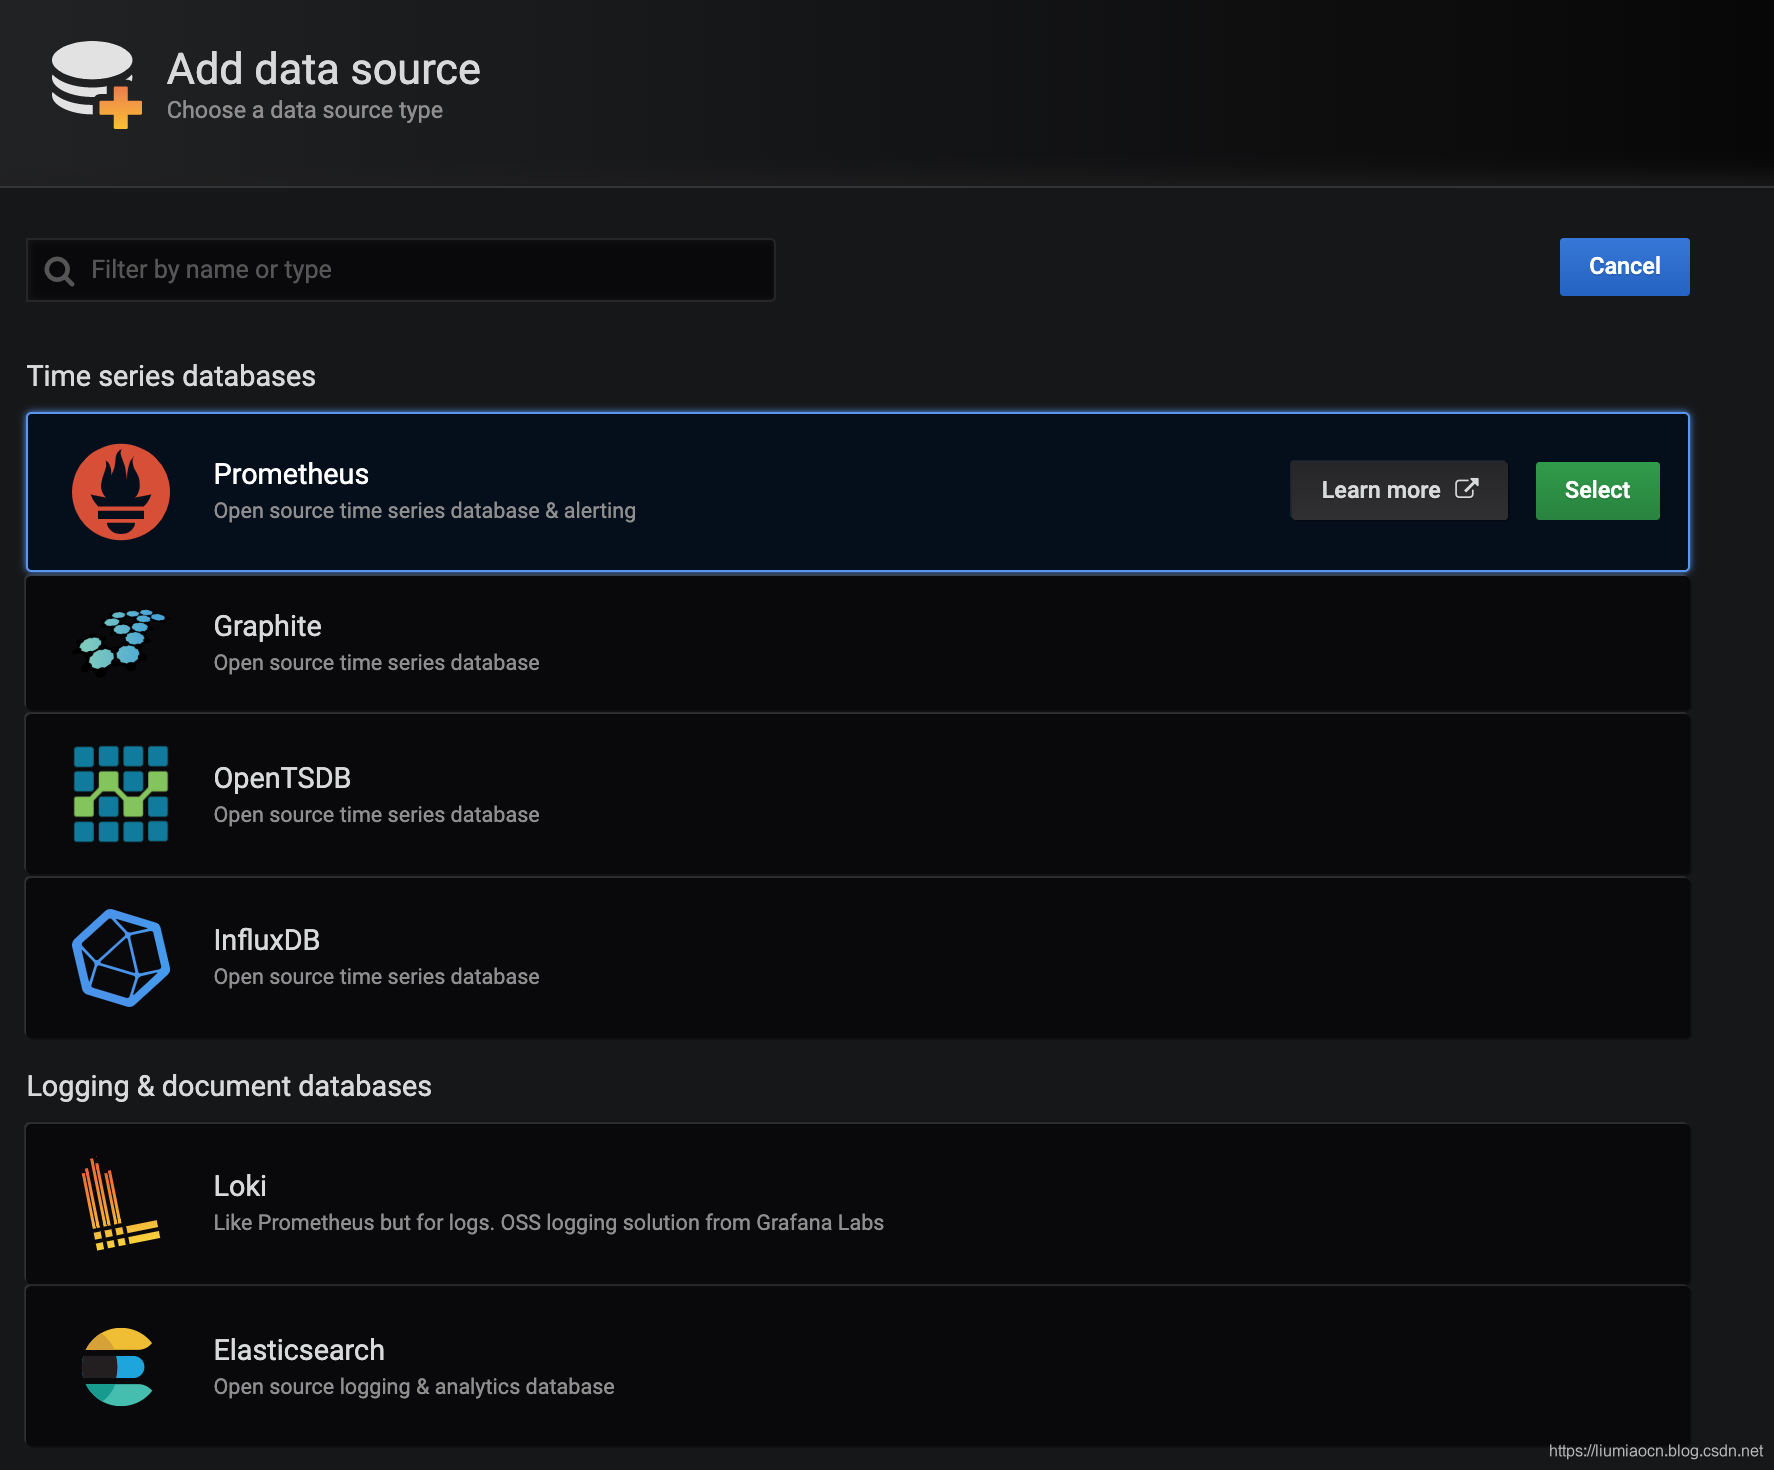
<!--  -->
- Grafana支持很多可视化展示的数据源,这里选择Prometheus
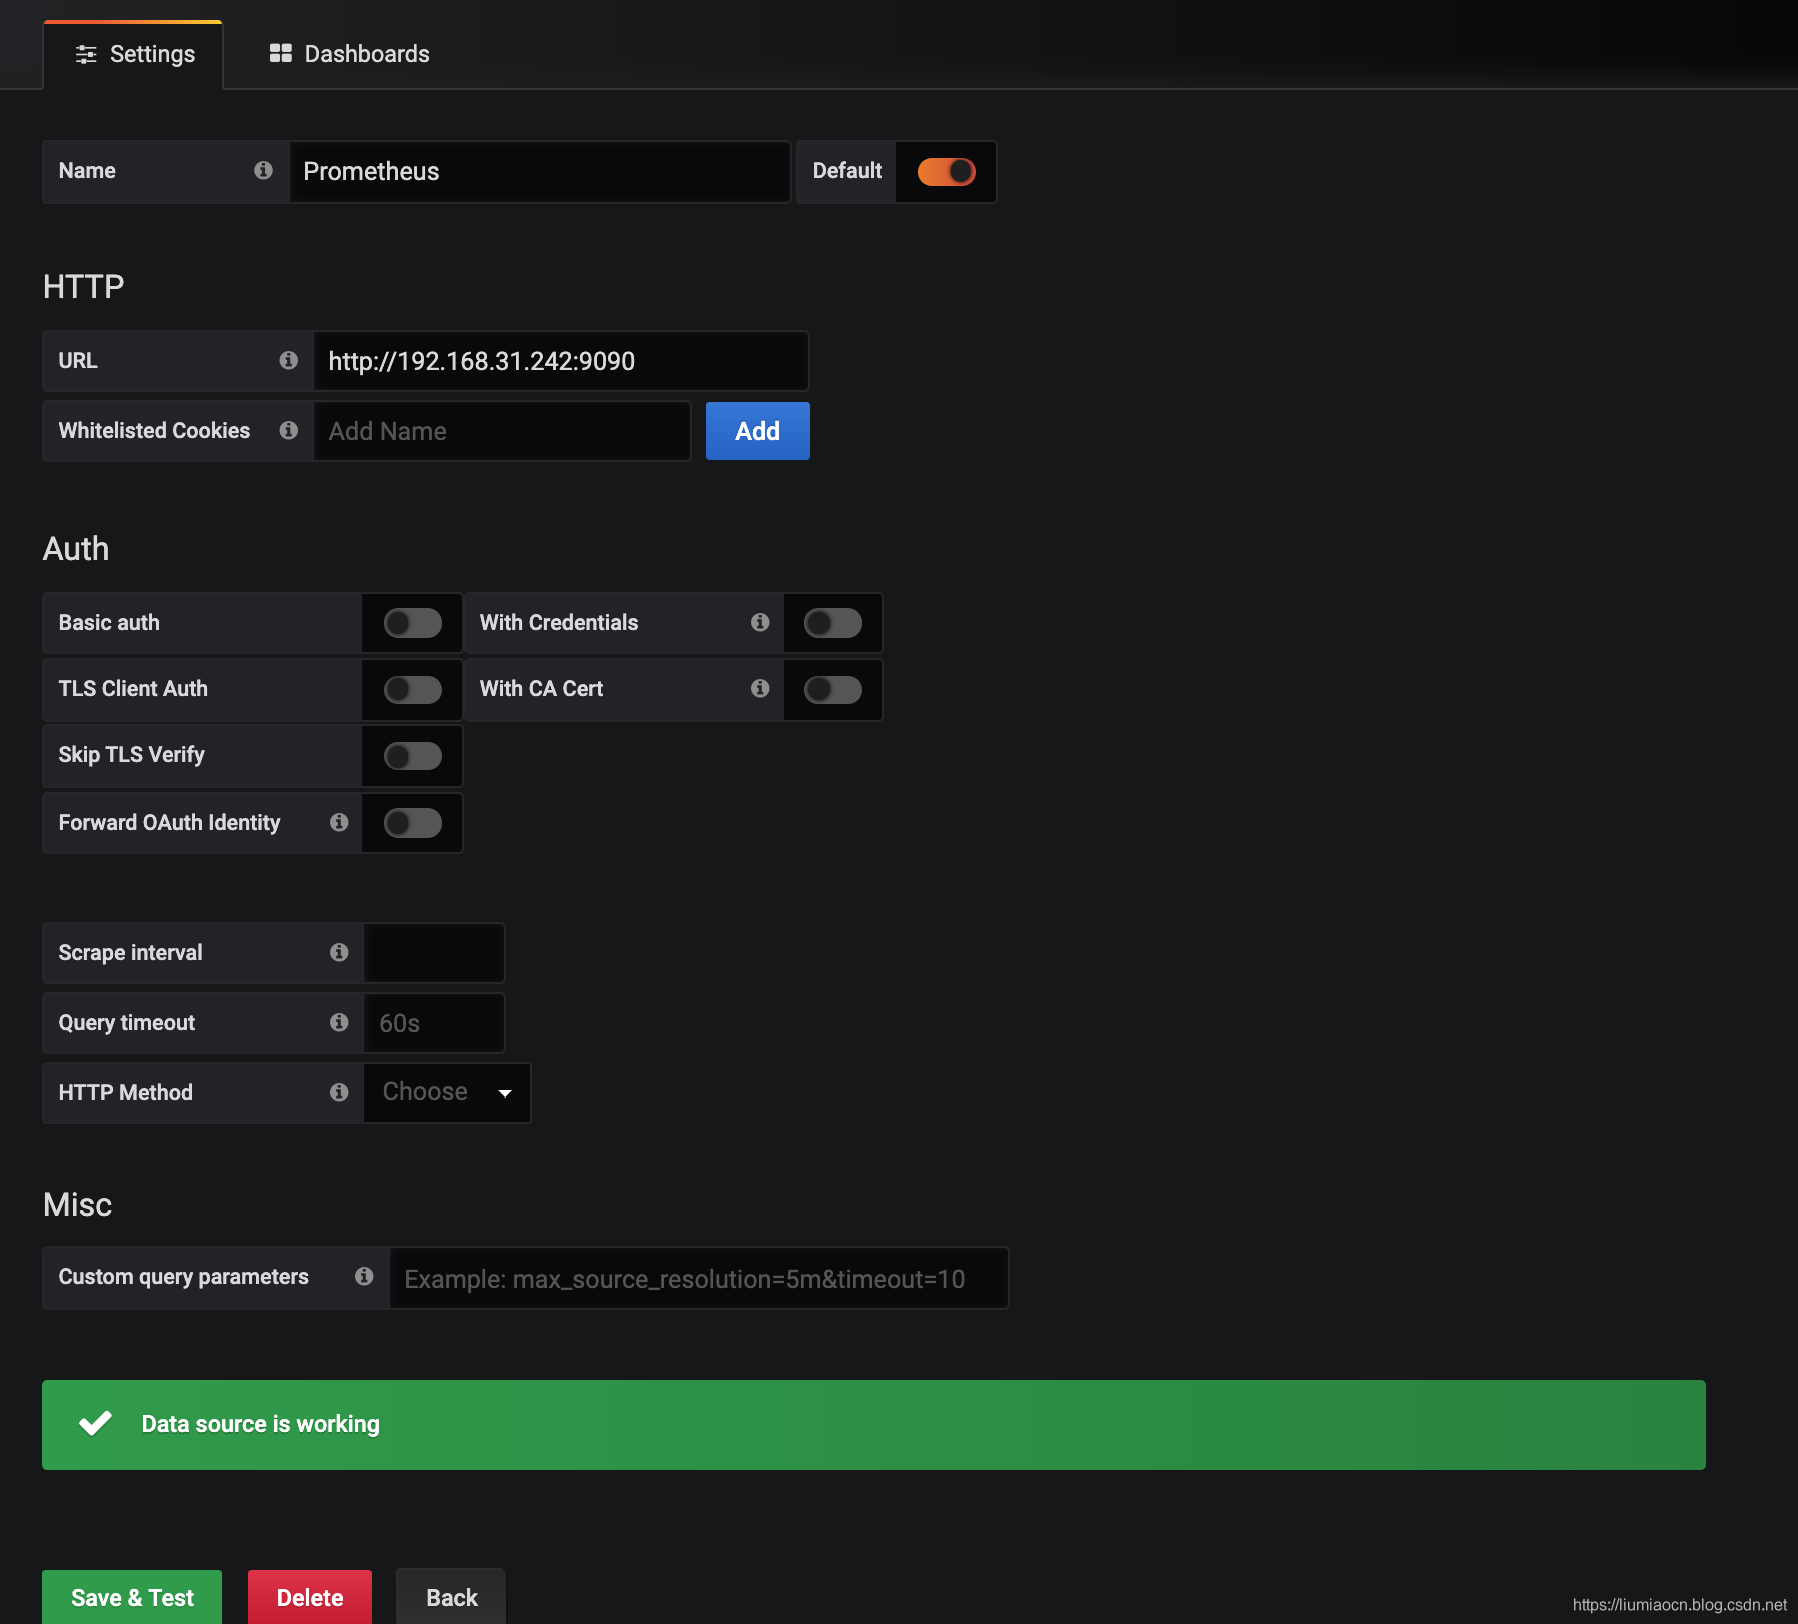
<!--  -->
- 设定Prometheus的URL,由于本文示例中各个服务均使用单独的容器启动,所以这里直接使用可以访问的IP来进行设定,除了IP的设定之外其余均可使用缺省设定,点击Save & Test按钮确认连接是否正常
<!--  -->
- 这样数据源的添加就完成了,后续如果需要进行修改或者删除等操作,可通过下图左侧Configuration菜单中的data sources选项进行操作即可。
<!-- 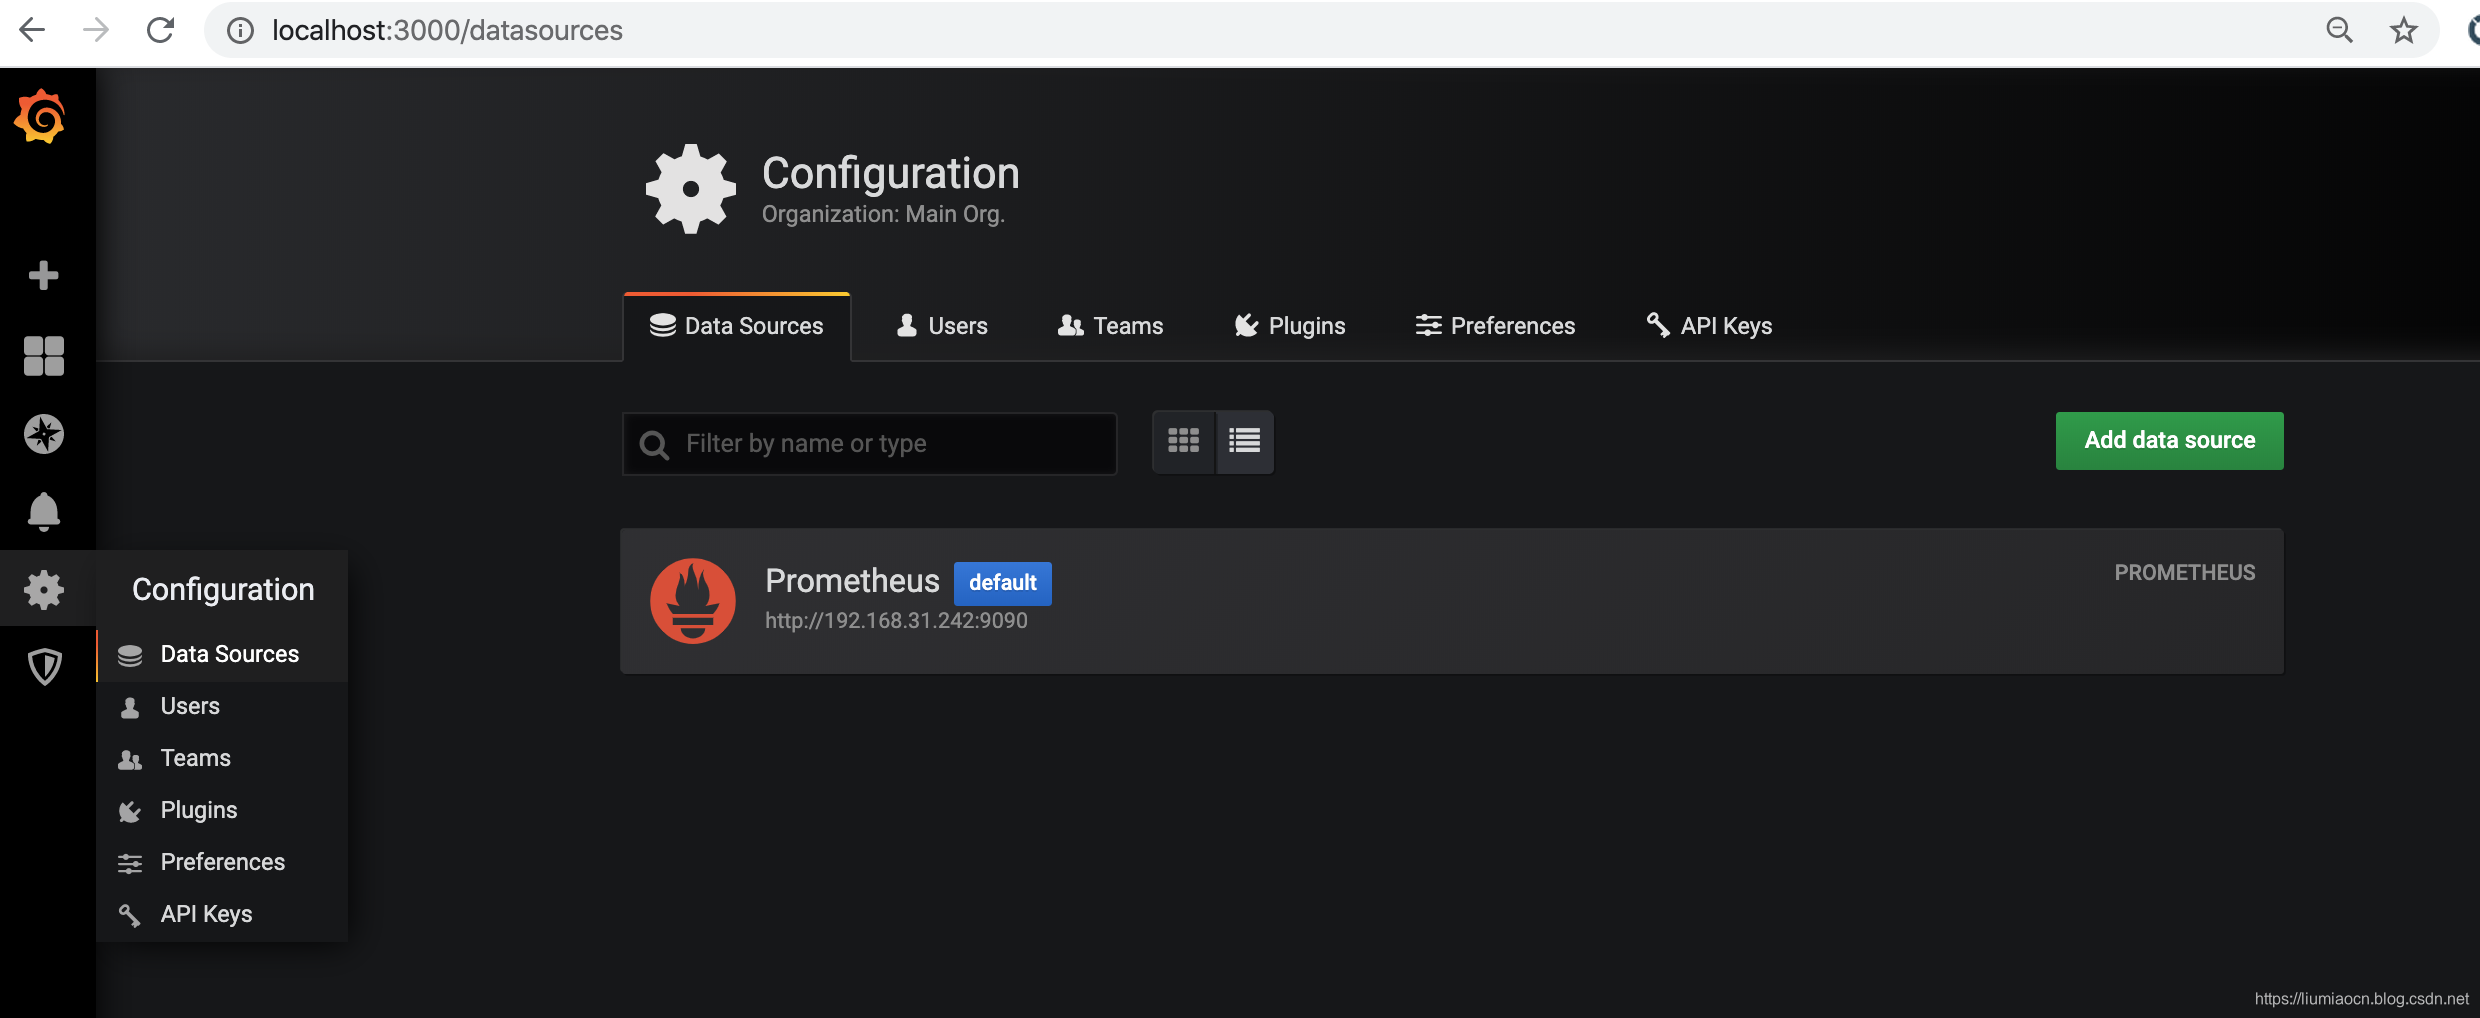 -->
设定可视化显示的仪表盘
- 在数据源配置和连通性测试成功之后,即可在Grafana中创建定制的仪表盘了。点击下图中的New Dashboard按钮或者左侧Dashboard菜单的Manage选项即可进行仪表盘的创建。
<!-- 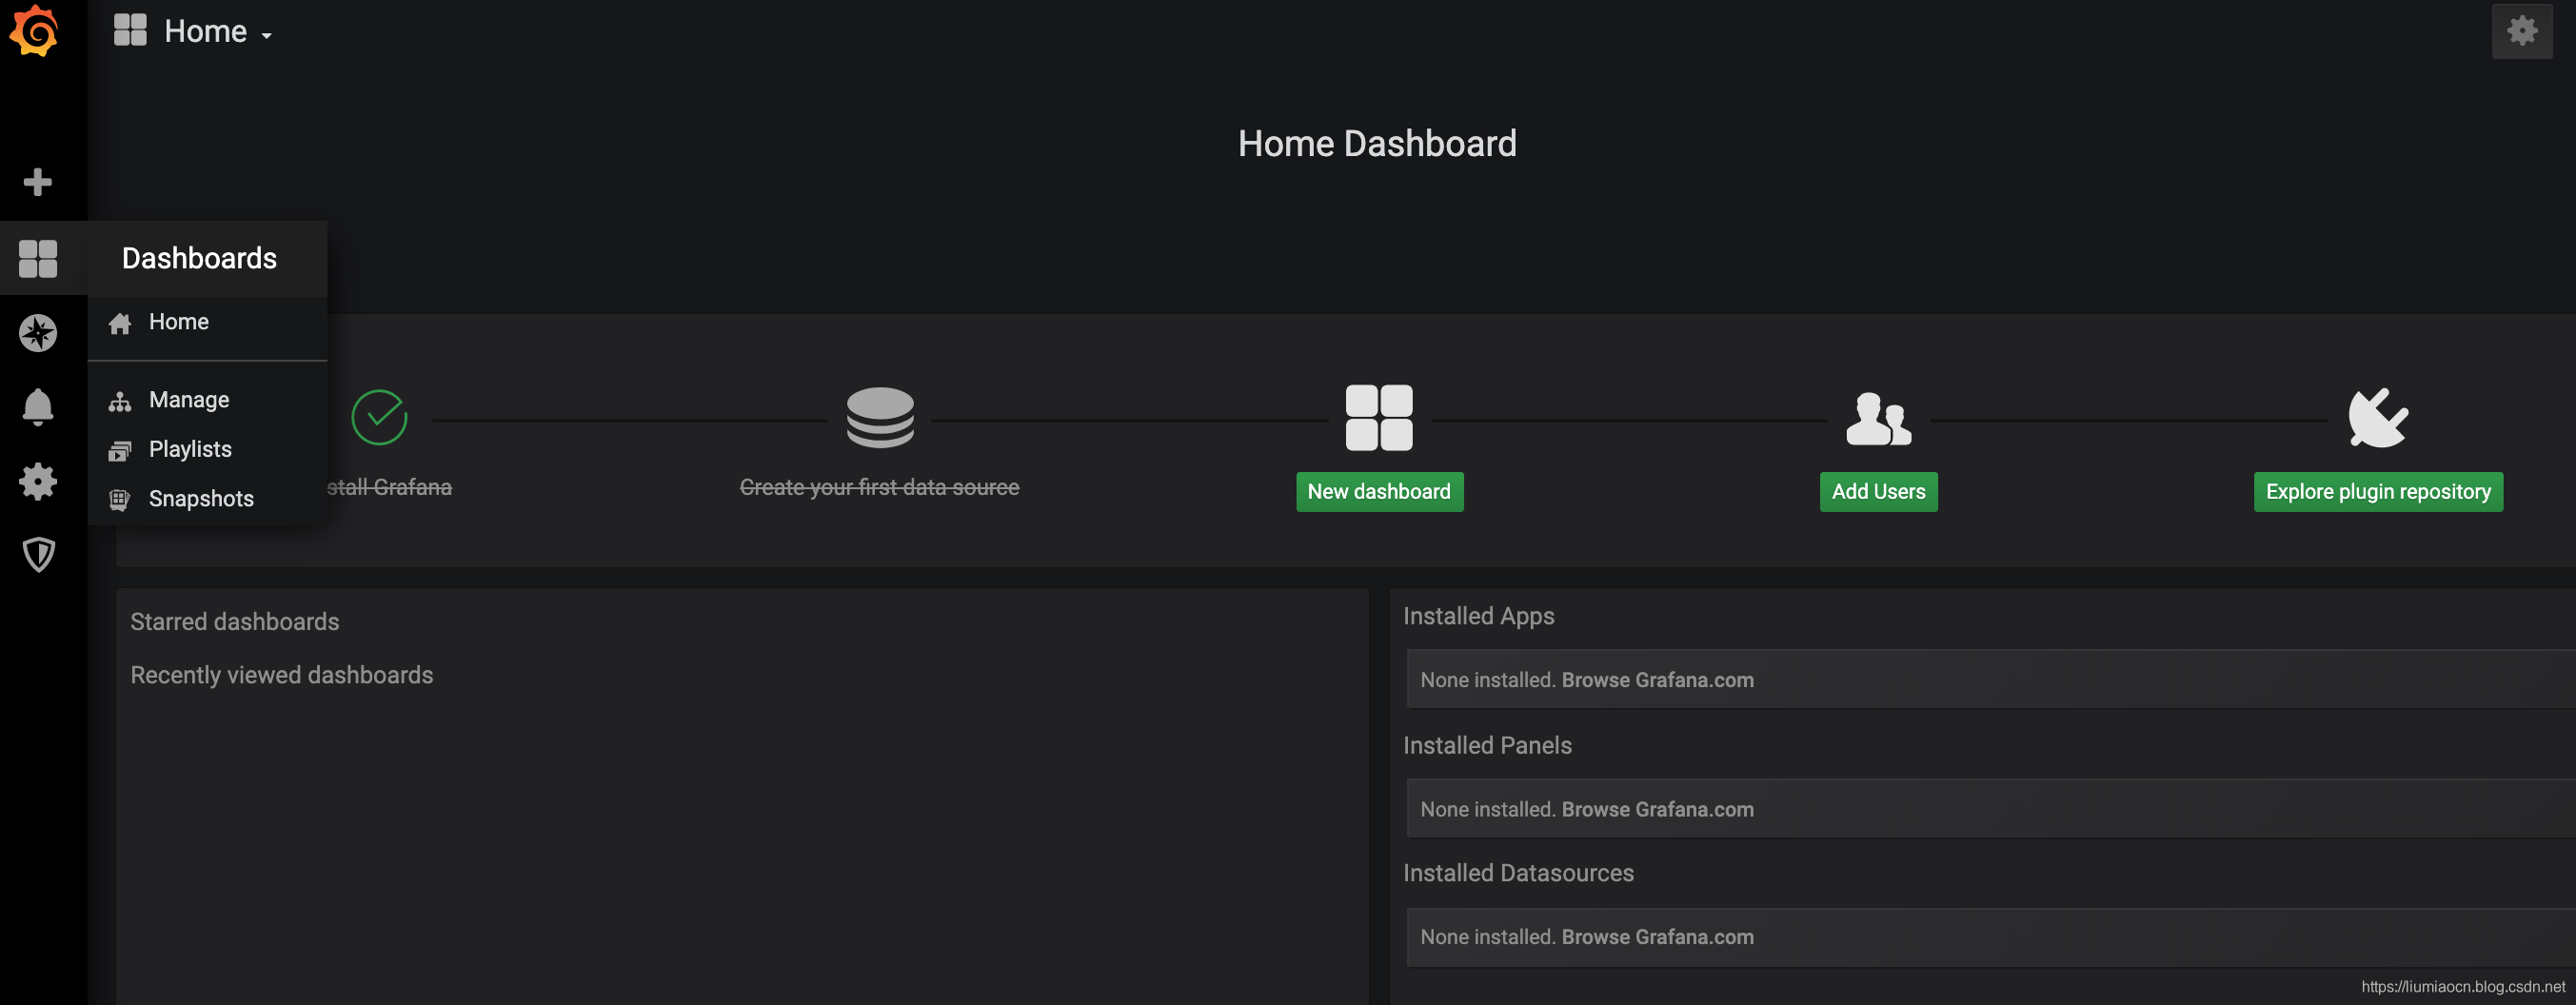 -->
- 在接下来的页面中选择Choose Visualization
<!-- 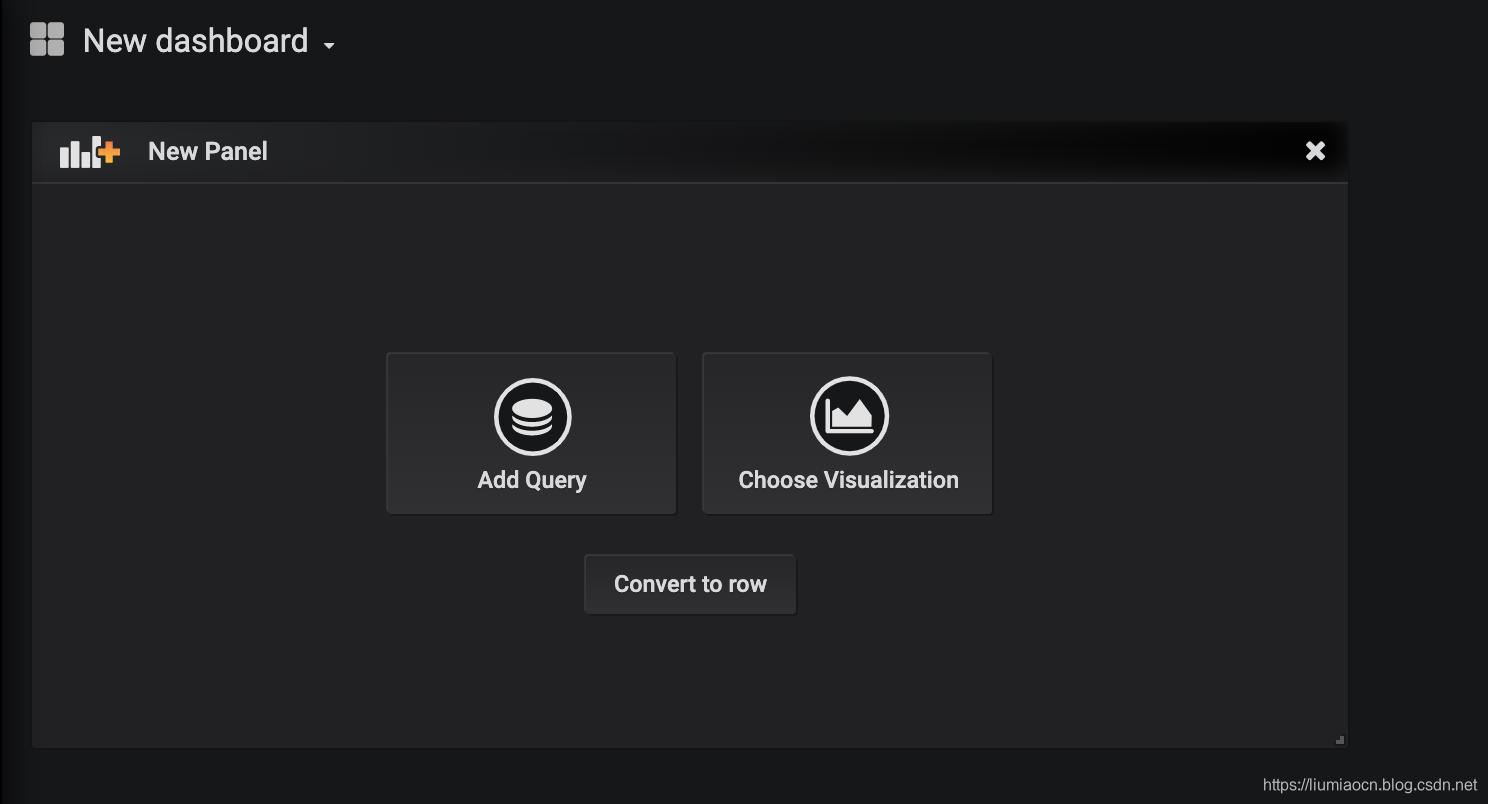 -->
- 点击Panel Title下拉菜单的Edit选项即可进行编辑
<!-- 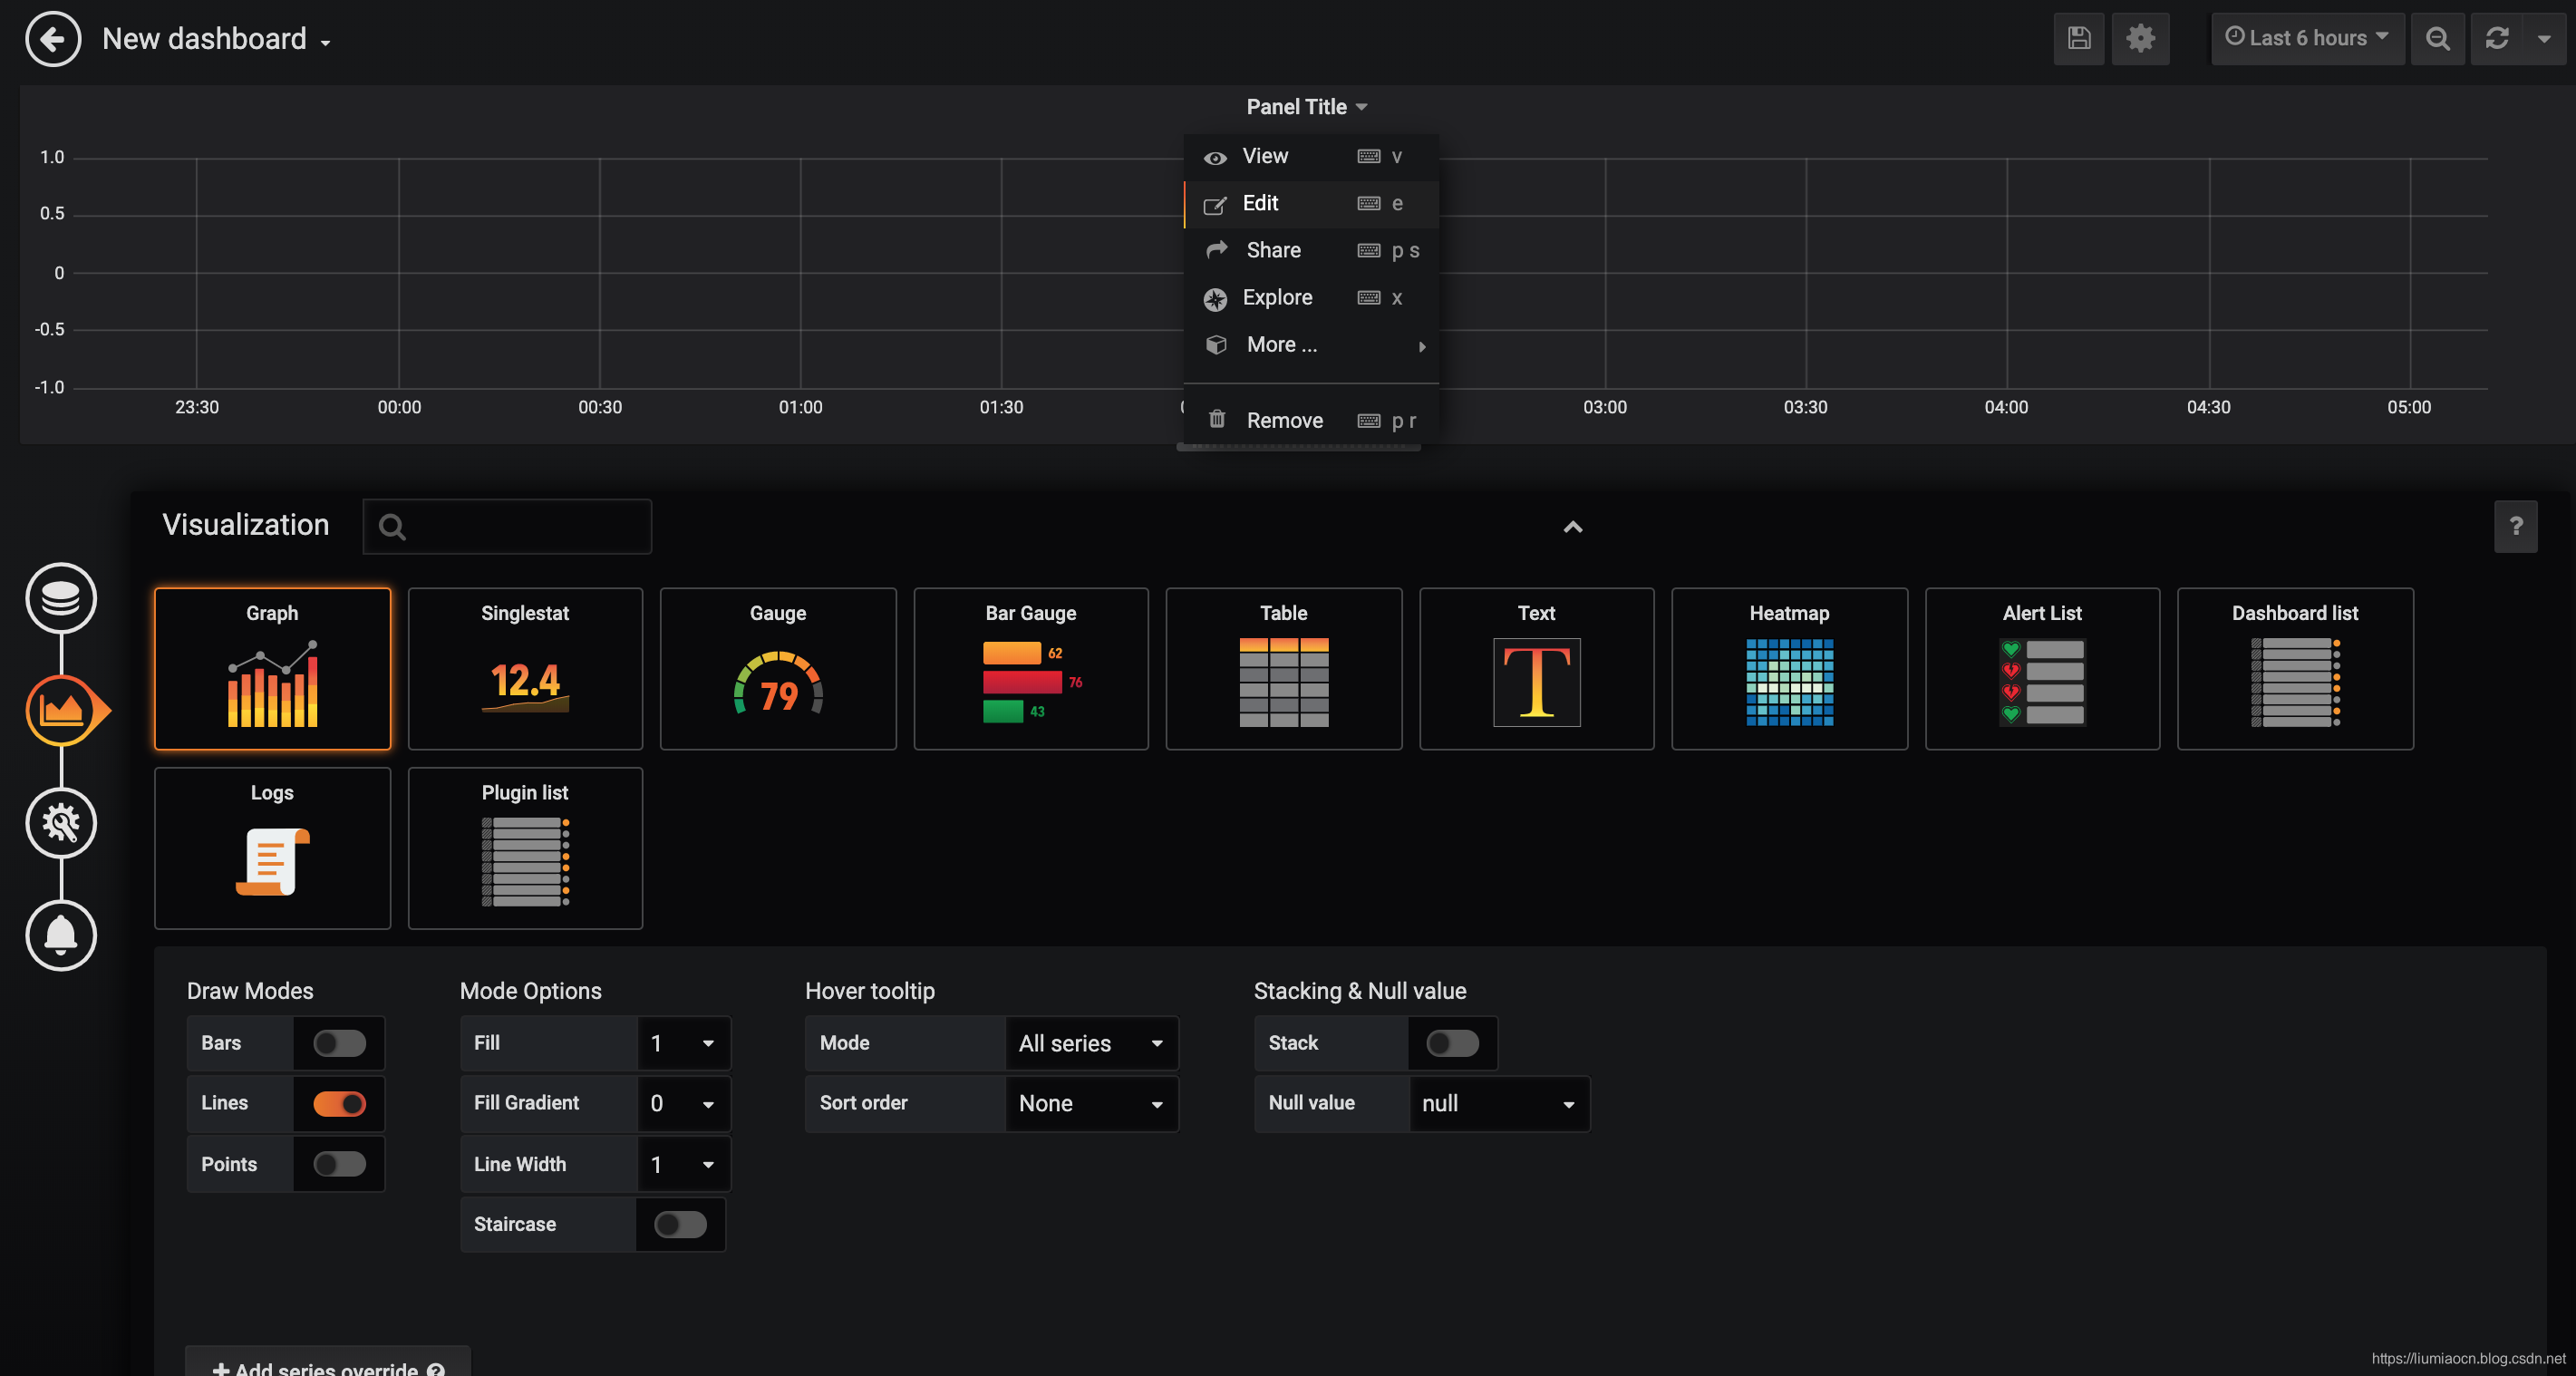 -->
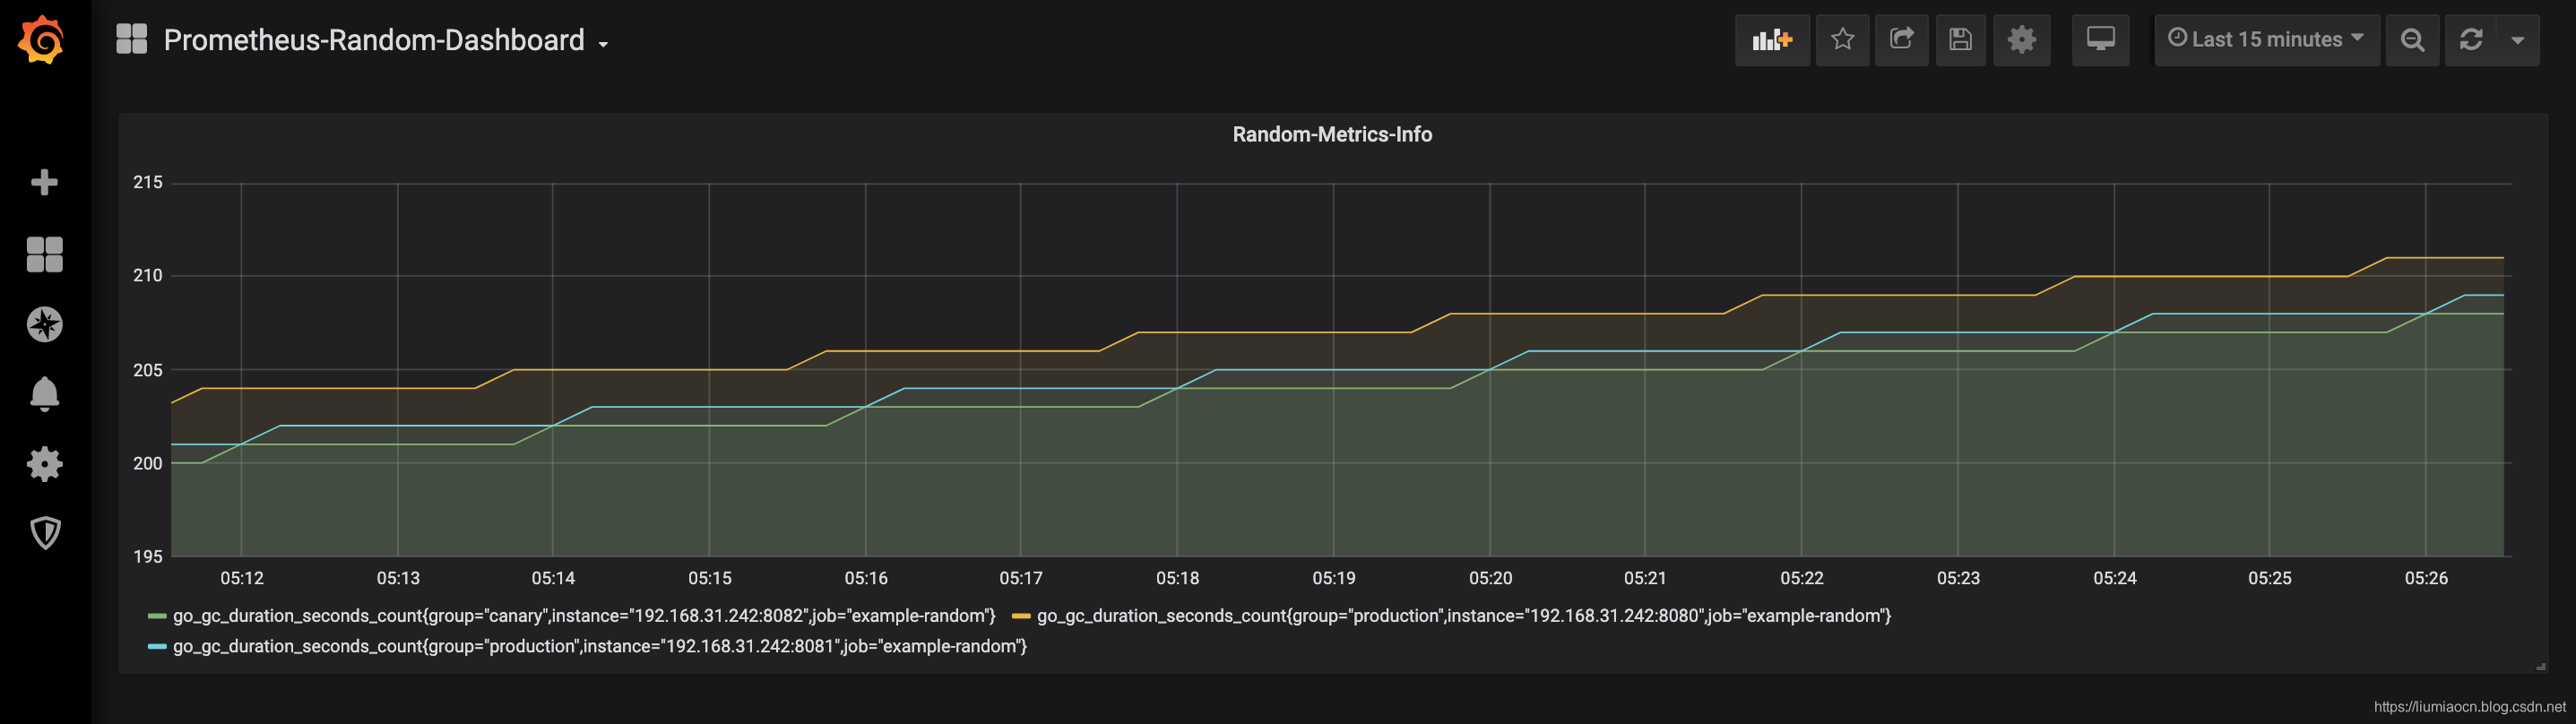
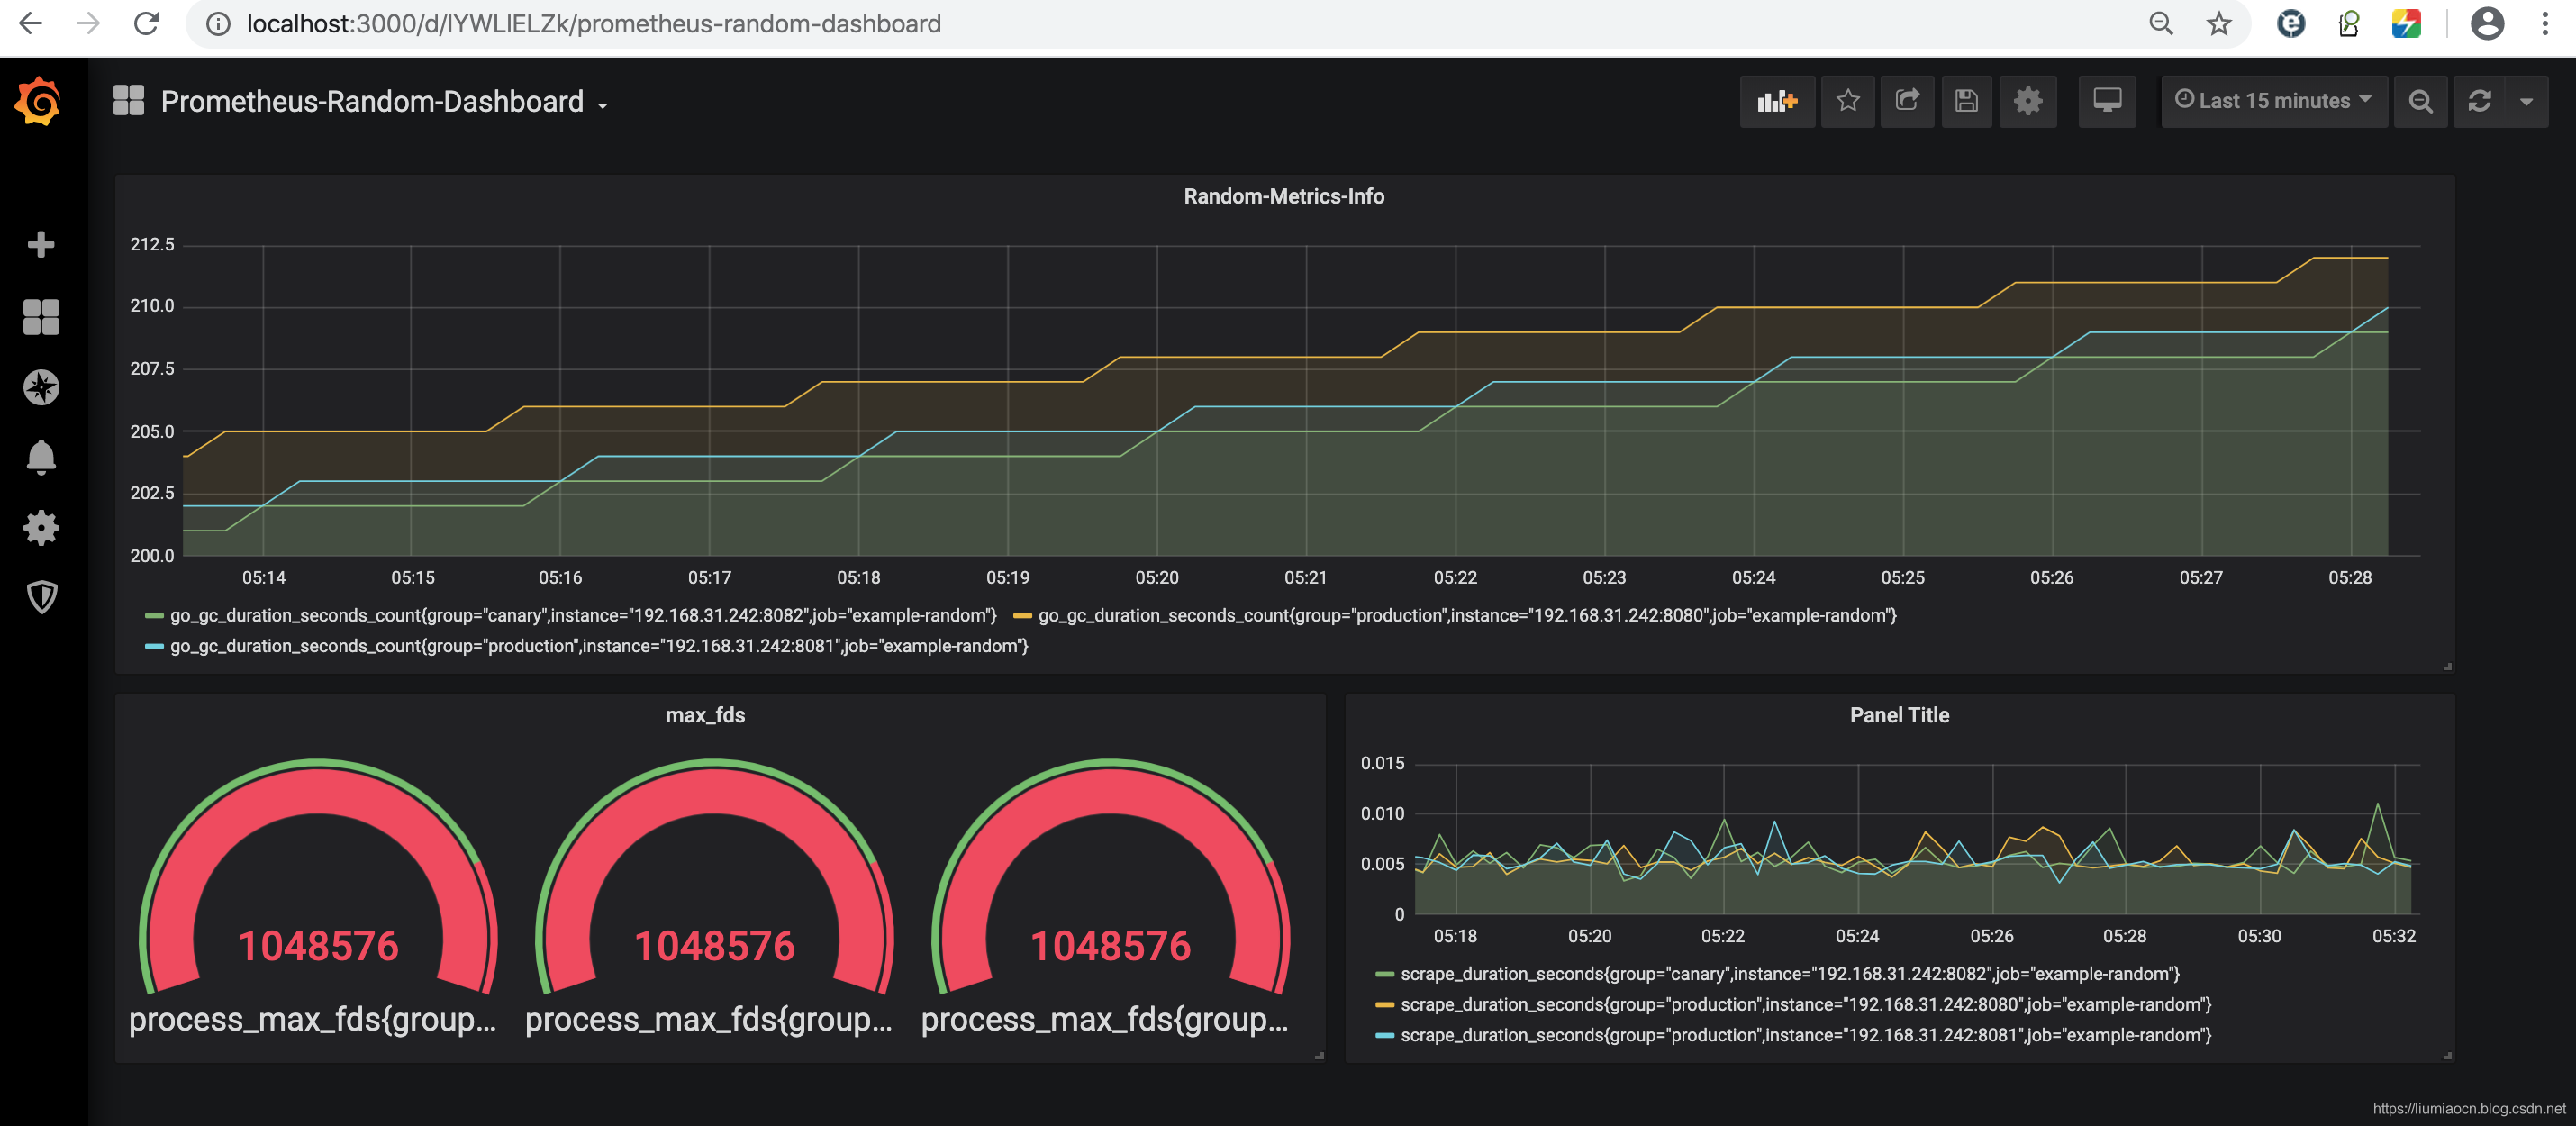
- 另外选择左侧的General按钮,则可对Panel Title的标题进行修改,比如此处修改为Random-Metrics-Info
<!-- 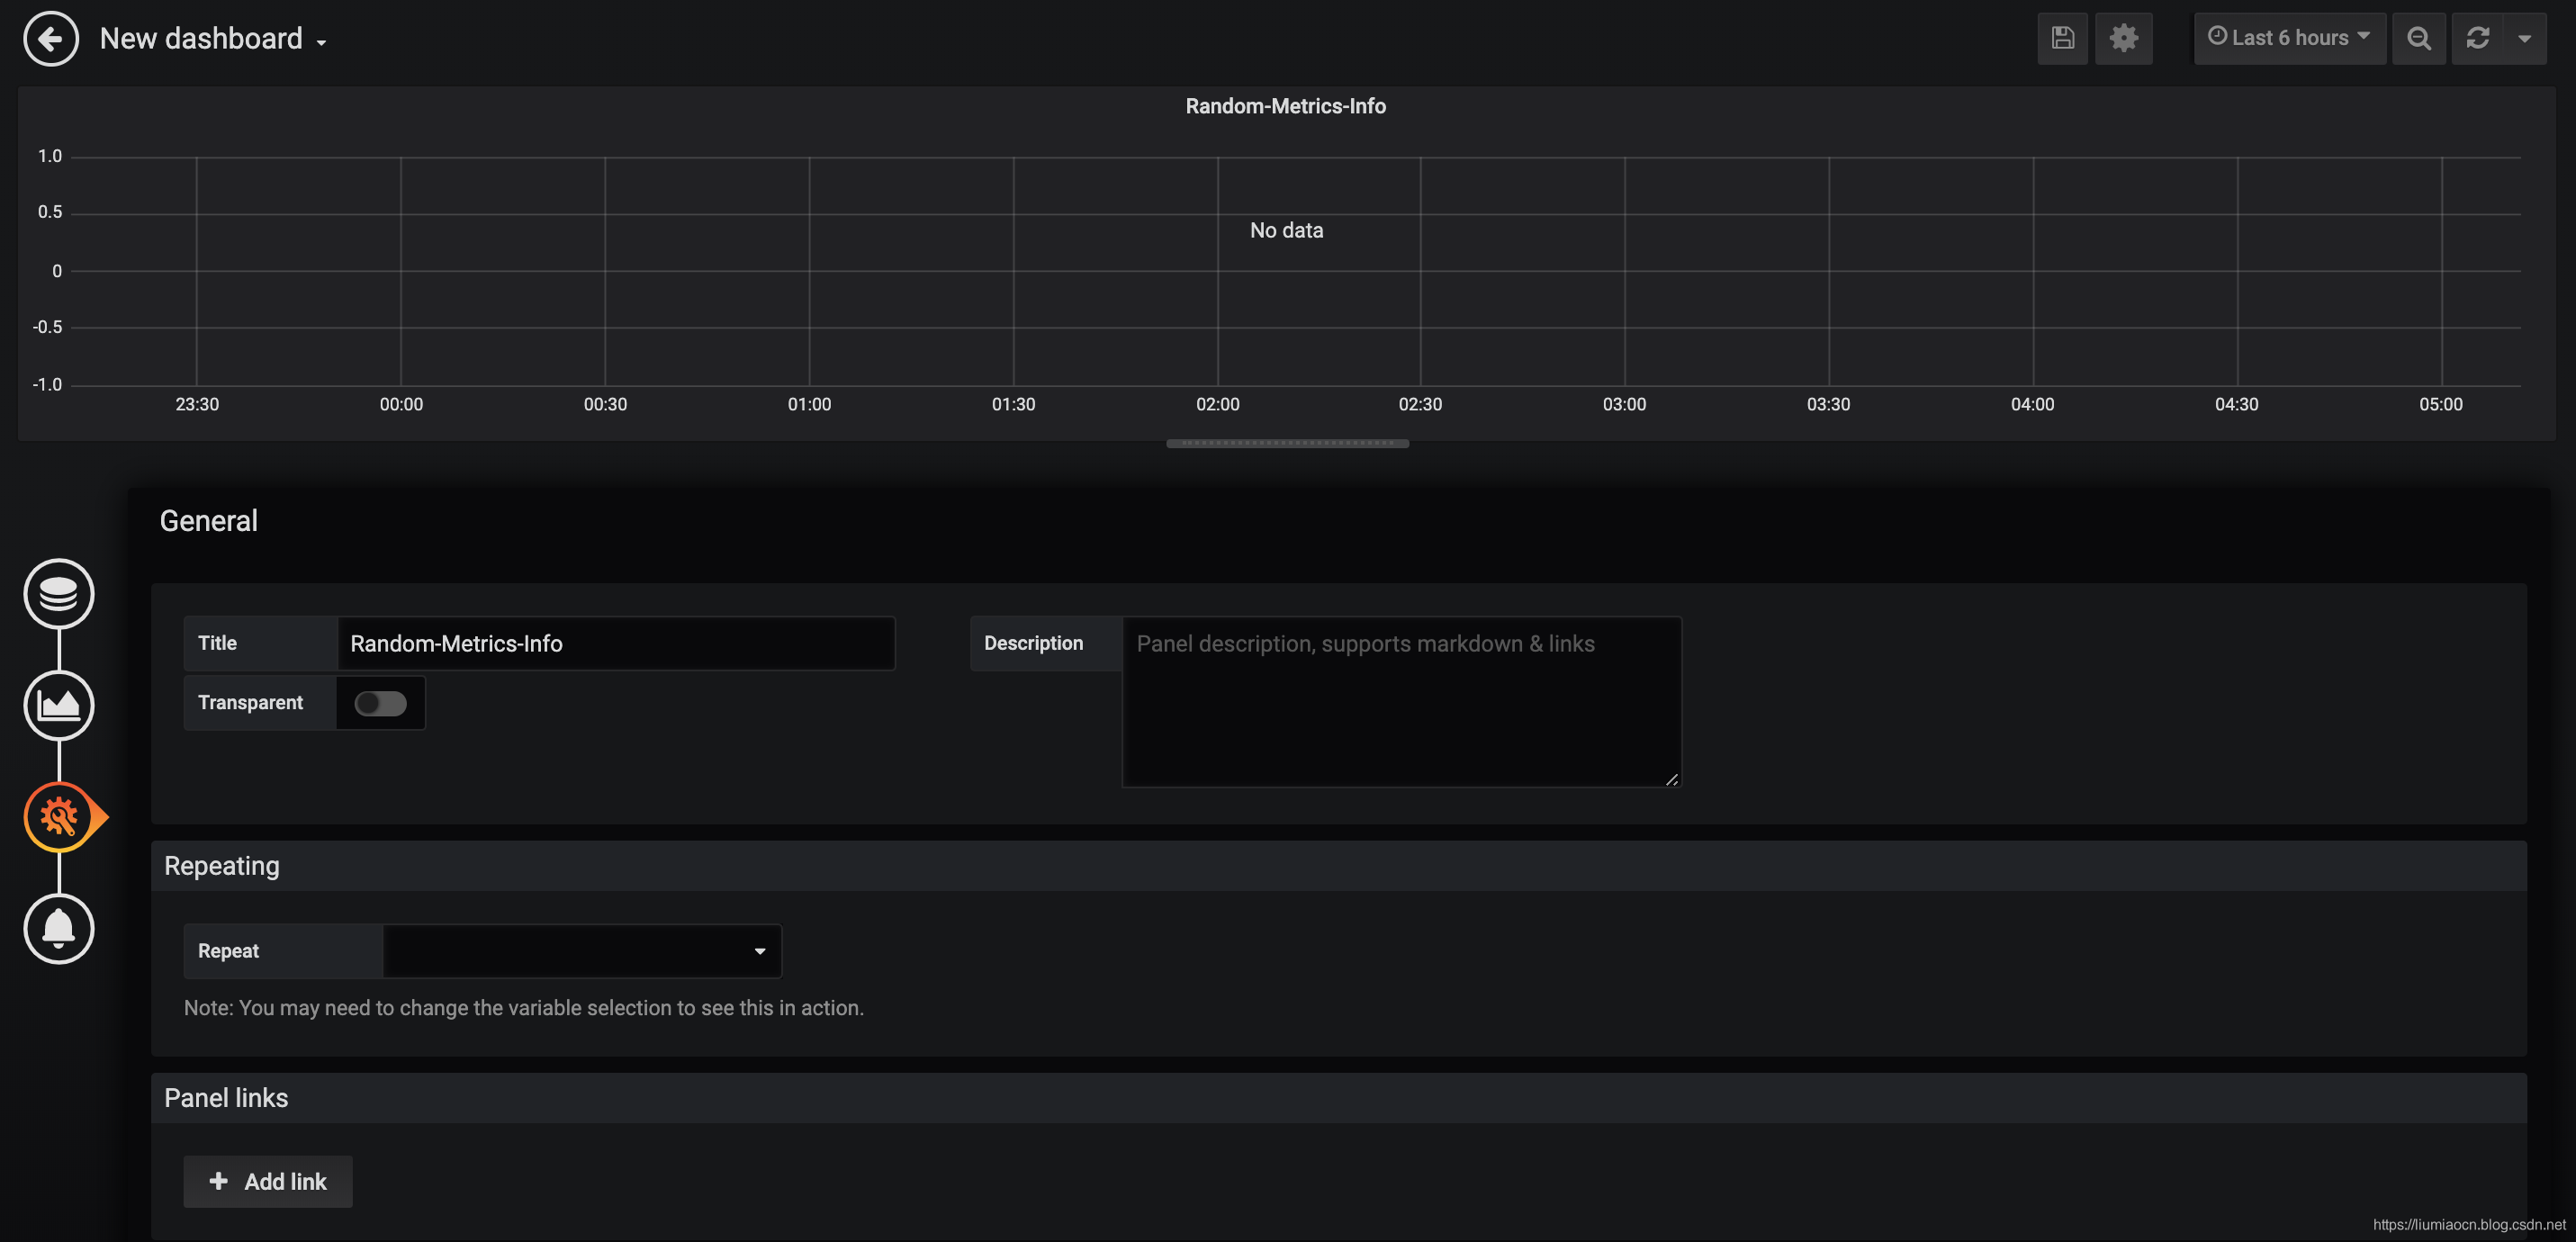 -->
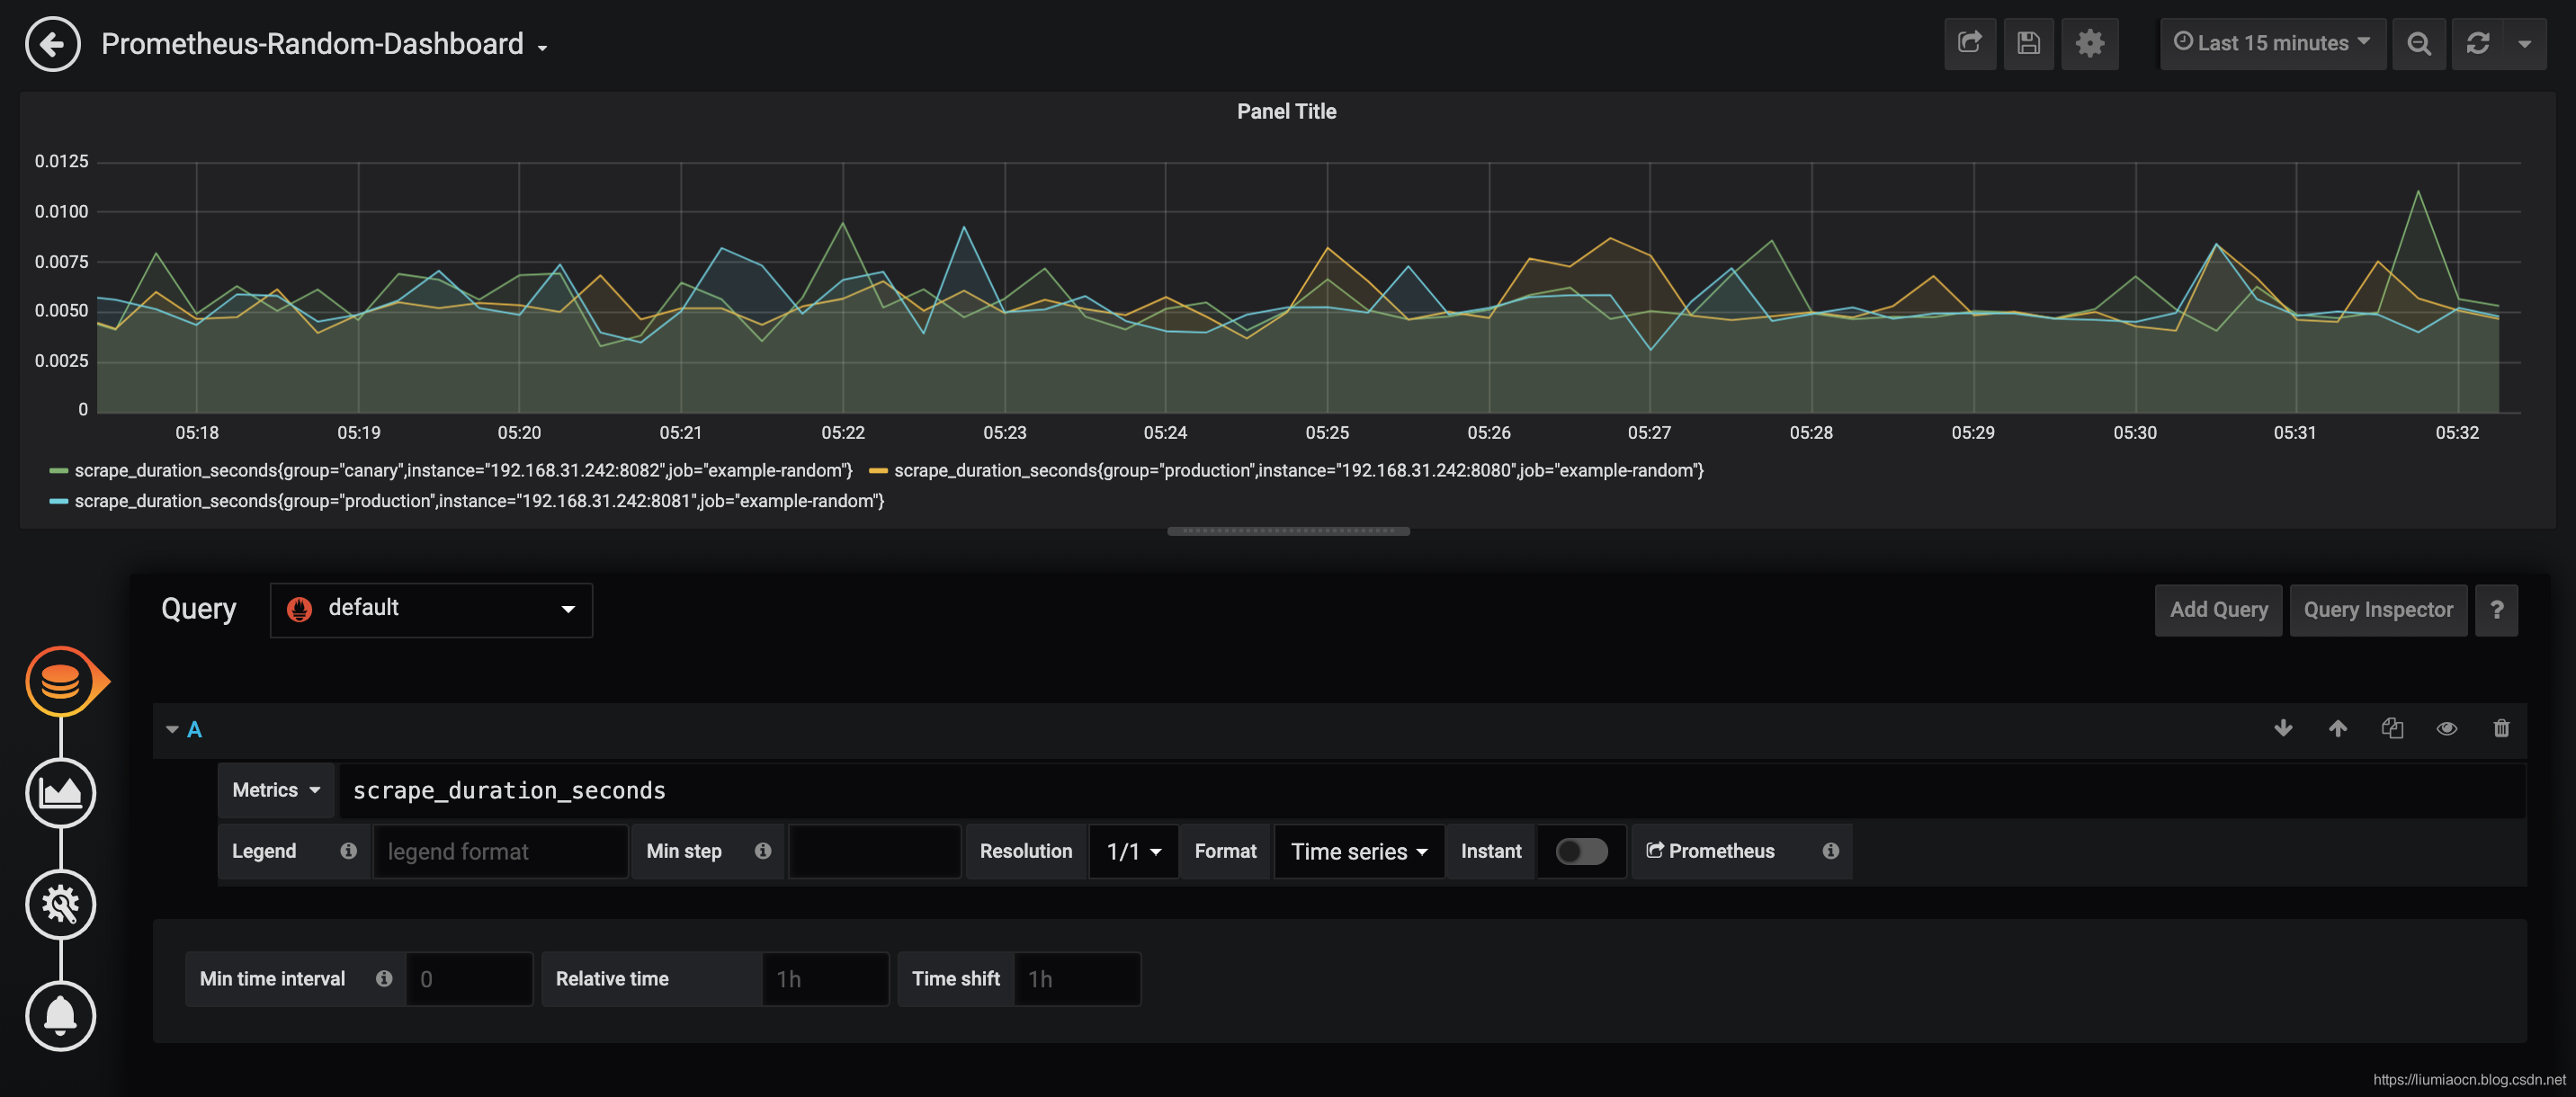
- 实际上这时并没有数据,所以这里点击左下侧四个按钮的第一个,是设定可视化来源的数据信息的。可以看到在Metrics页面可以看到监控的各项指标,这里选取其中一项进行显示,同时将时间范围设定为15分钟(这里只是为了方便示例结果的演示)
<!-- 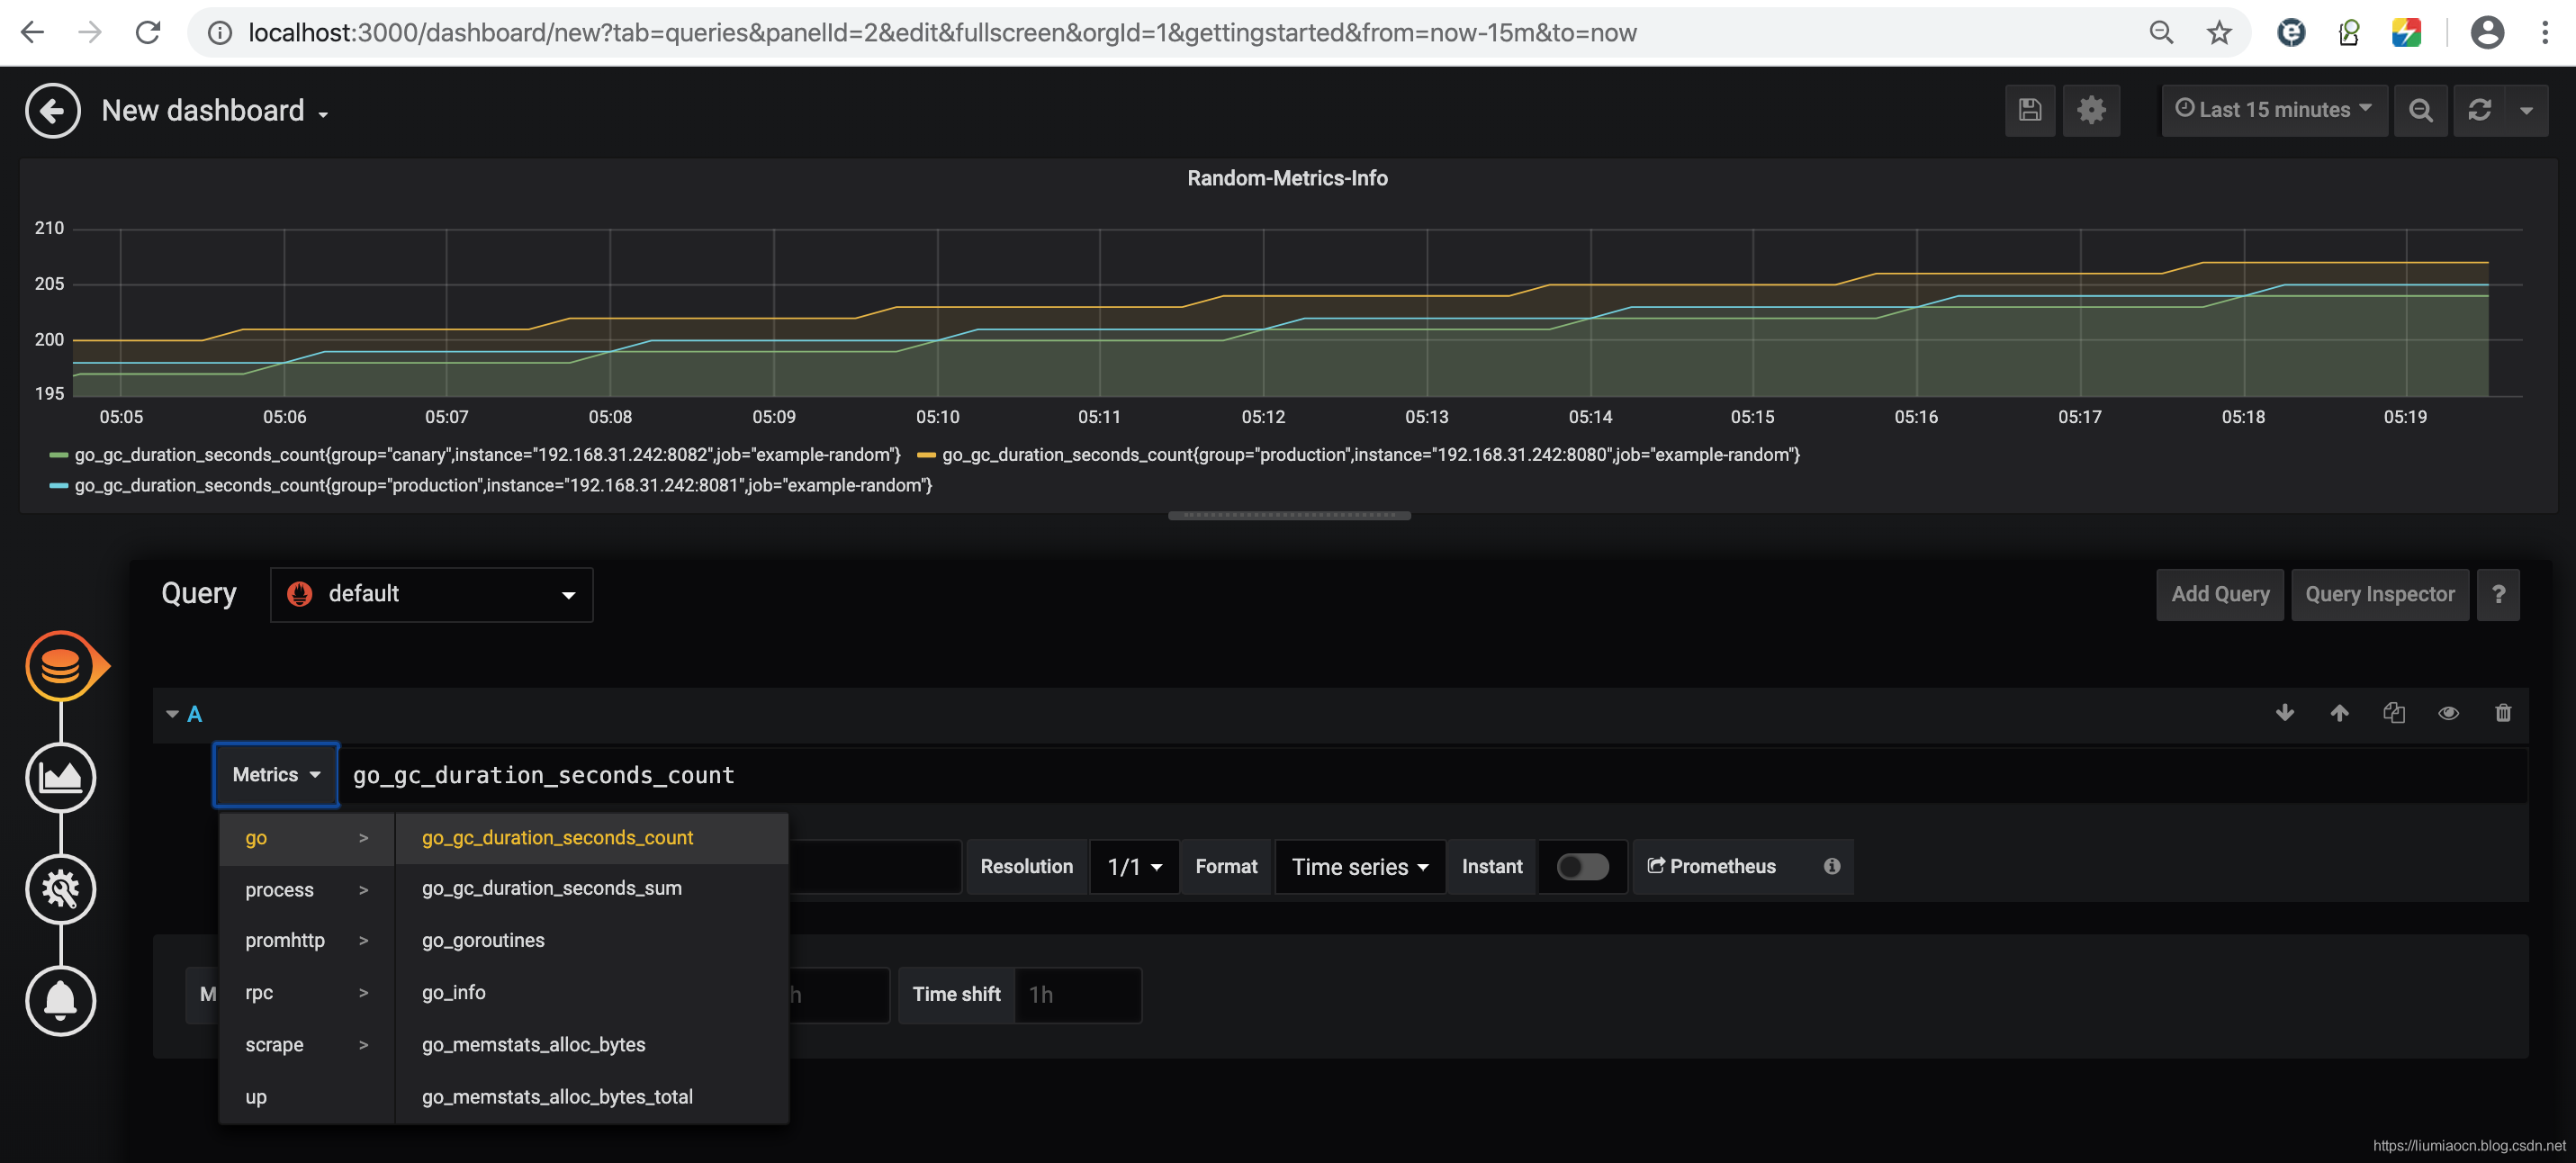 -->
- 点击保存按钮,将此Dashboard设定名称并点击Save按钮,缺省会保存到General目录下(也可以点击Gneral的下拉菜单创建新的保存目录)
<!-- 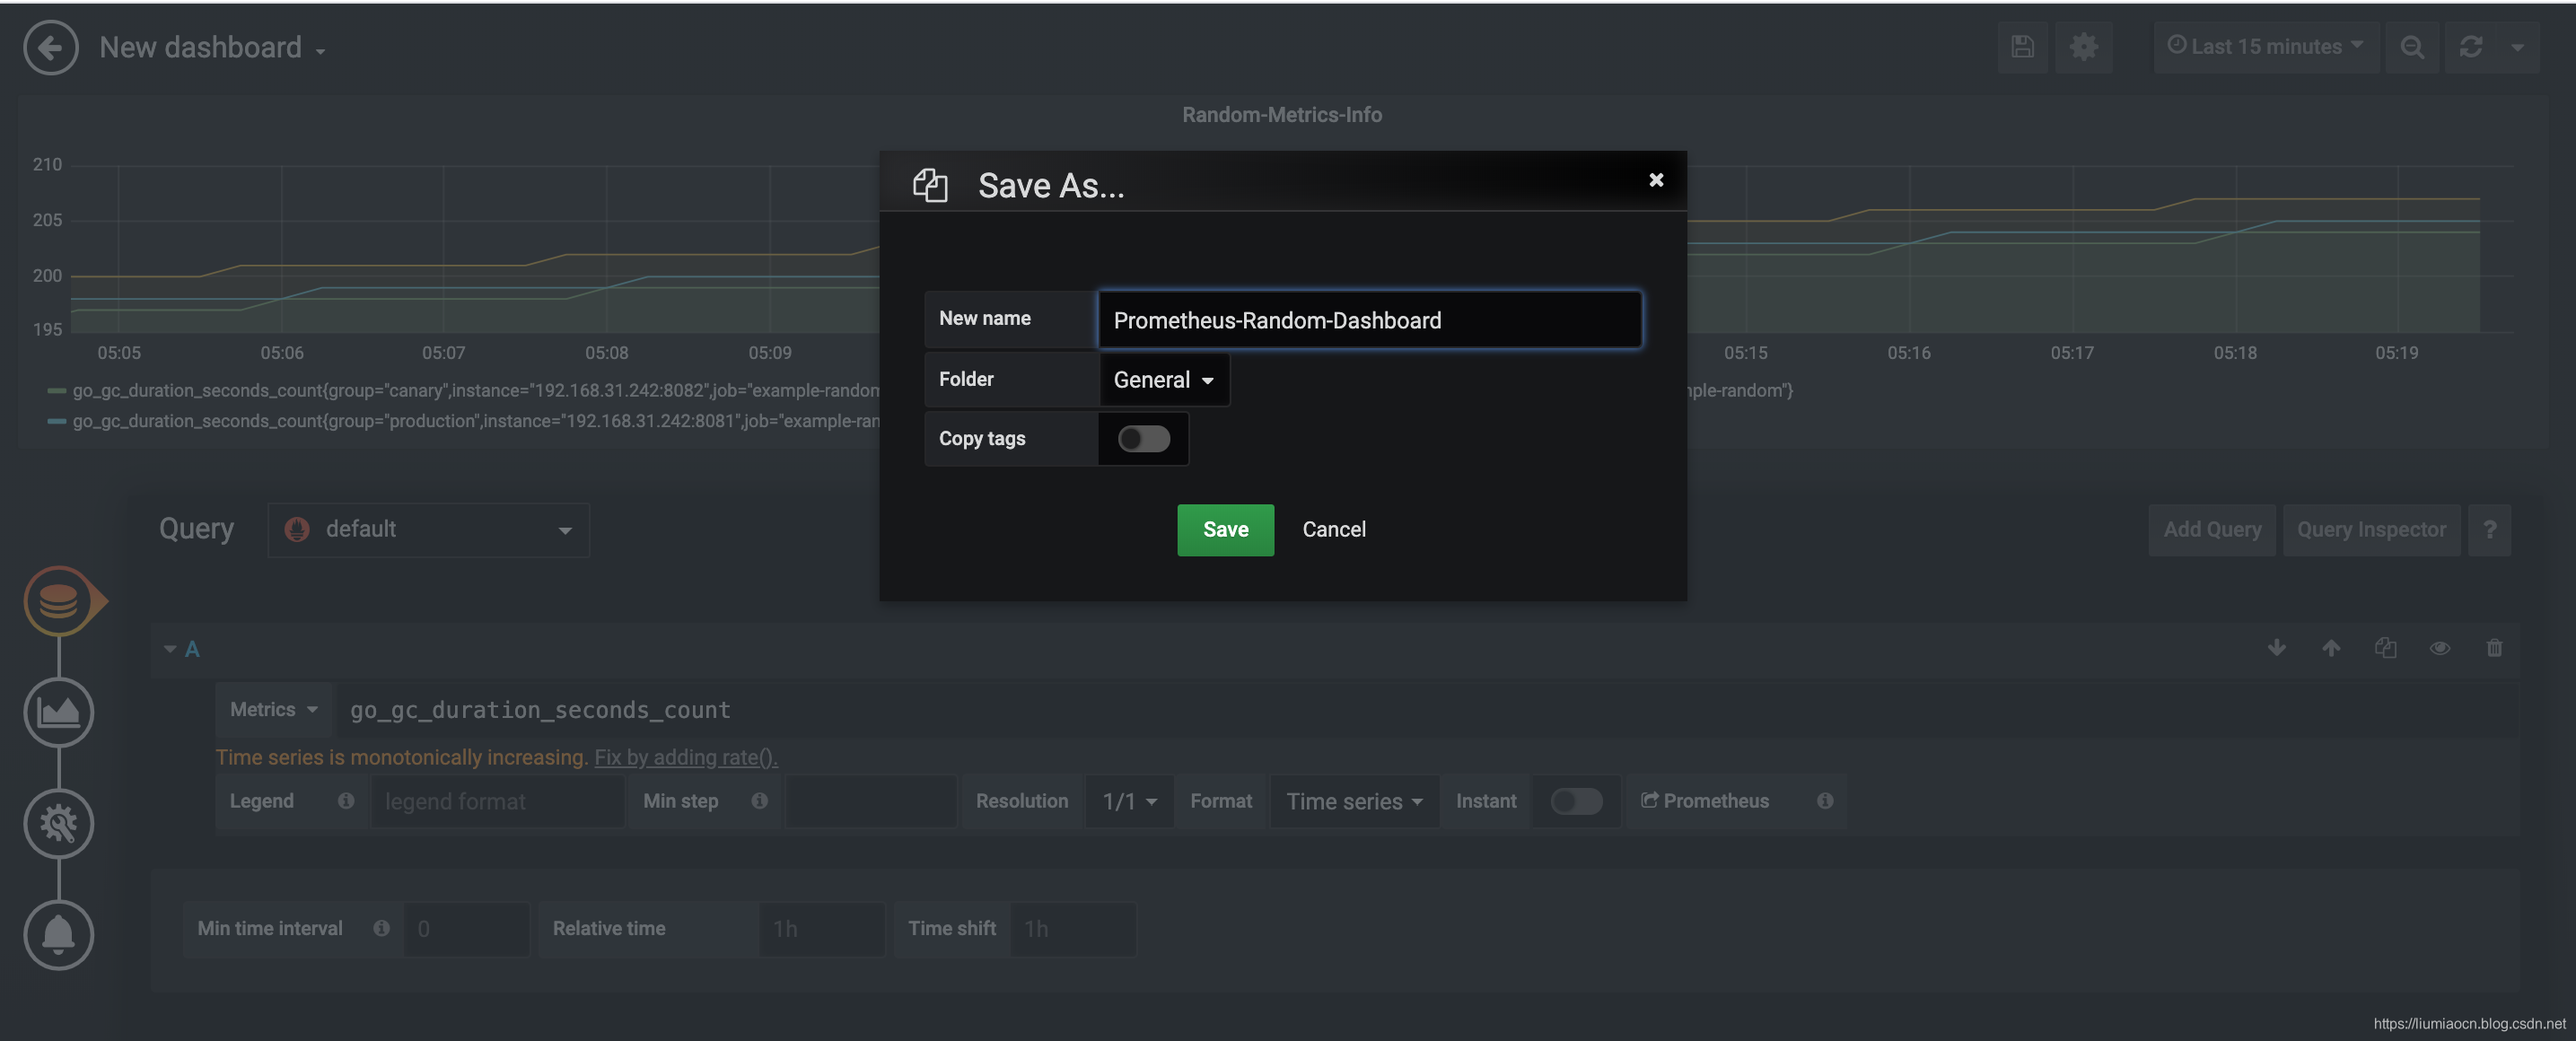 -->
- 保存之后结果如下所示
<!-- 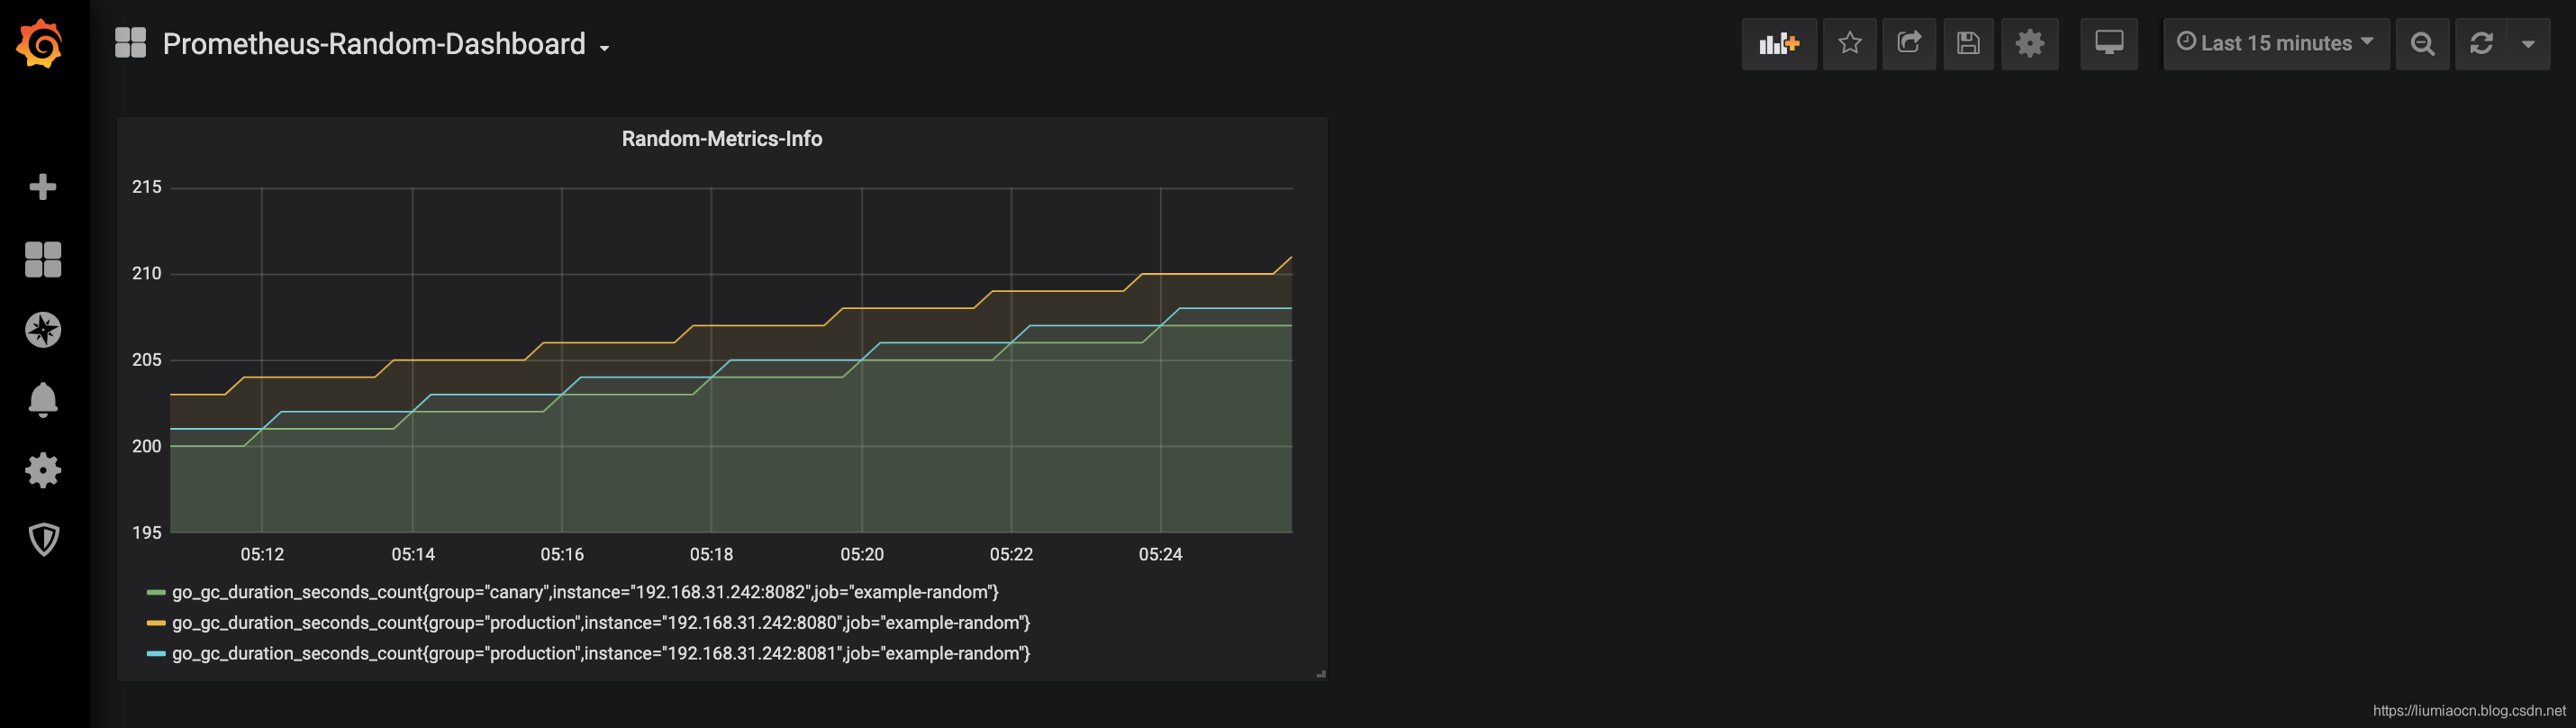 -->
- 这时就可以随意拖拽进行可视化显示的调节了
<!--  -->
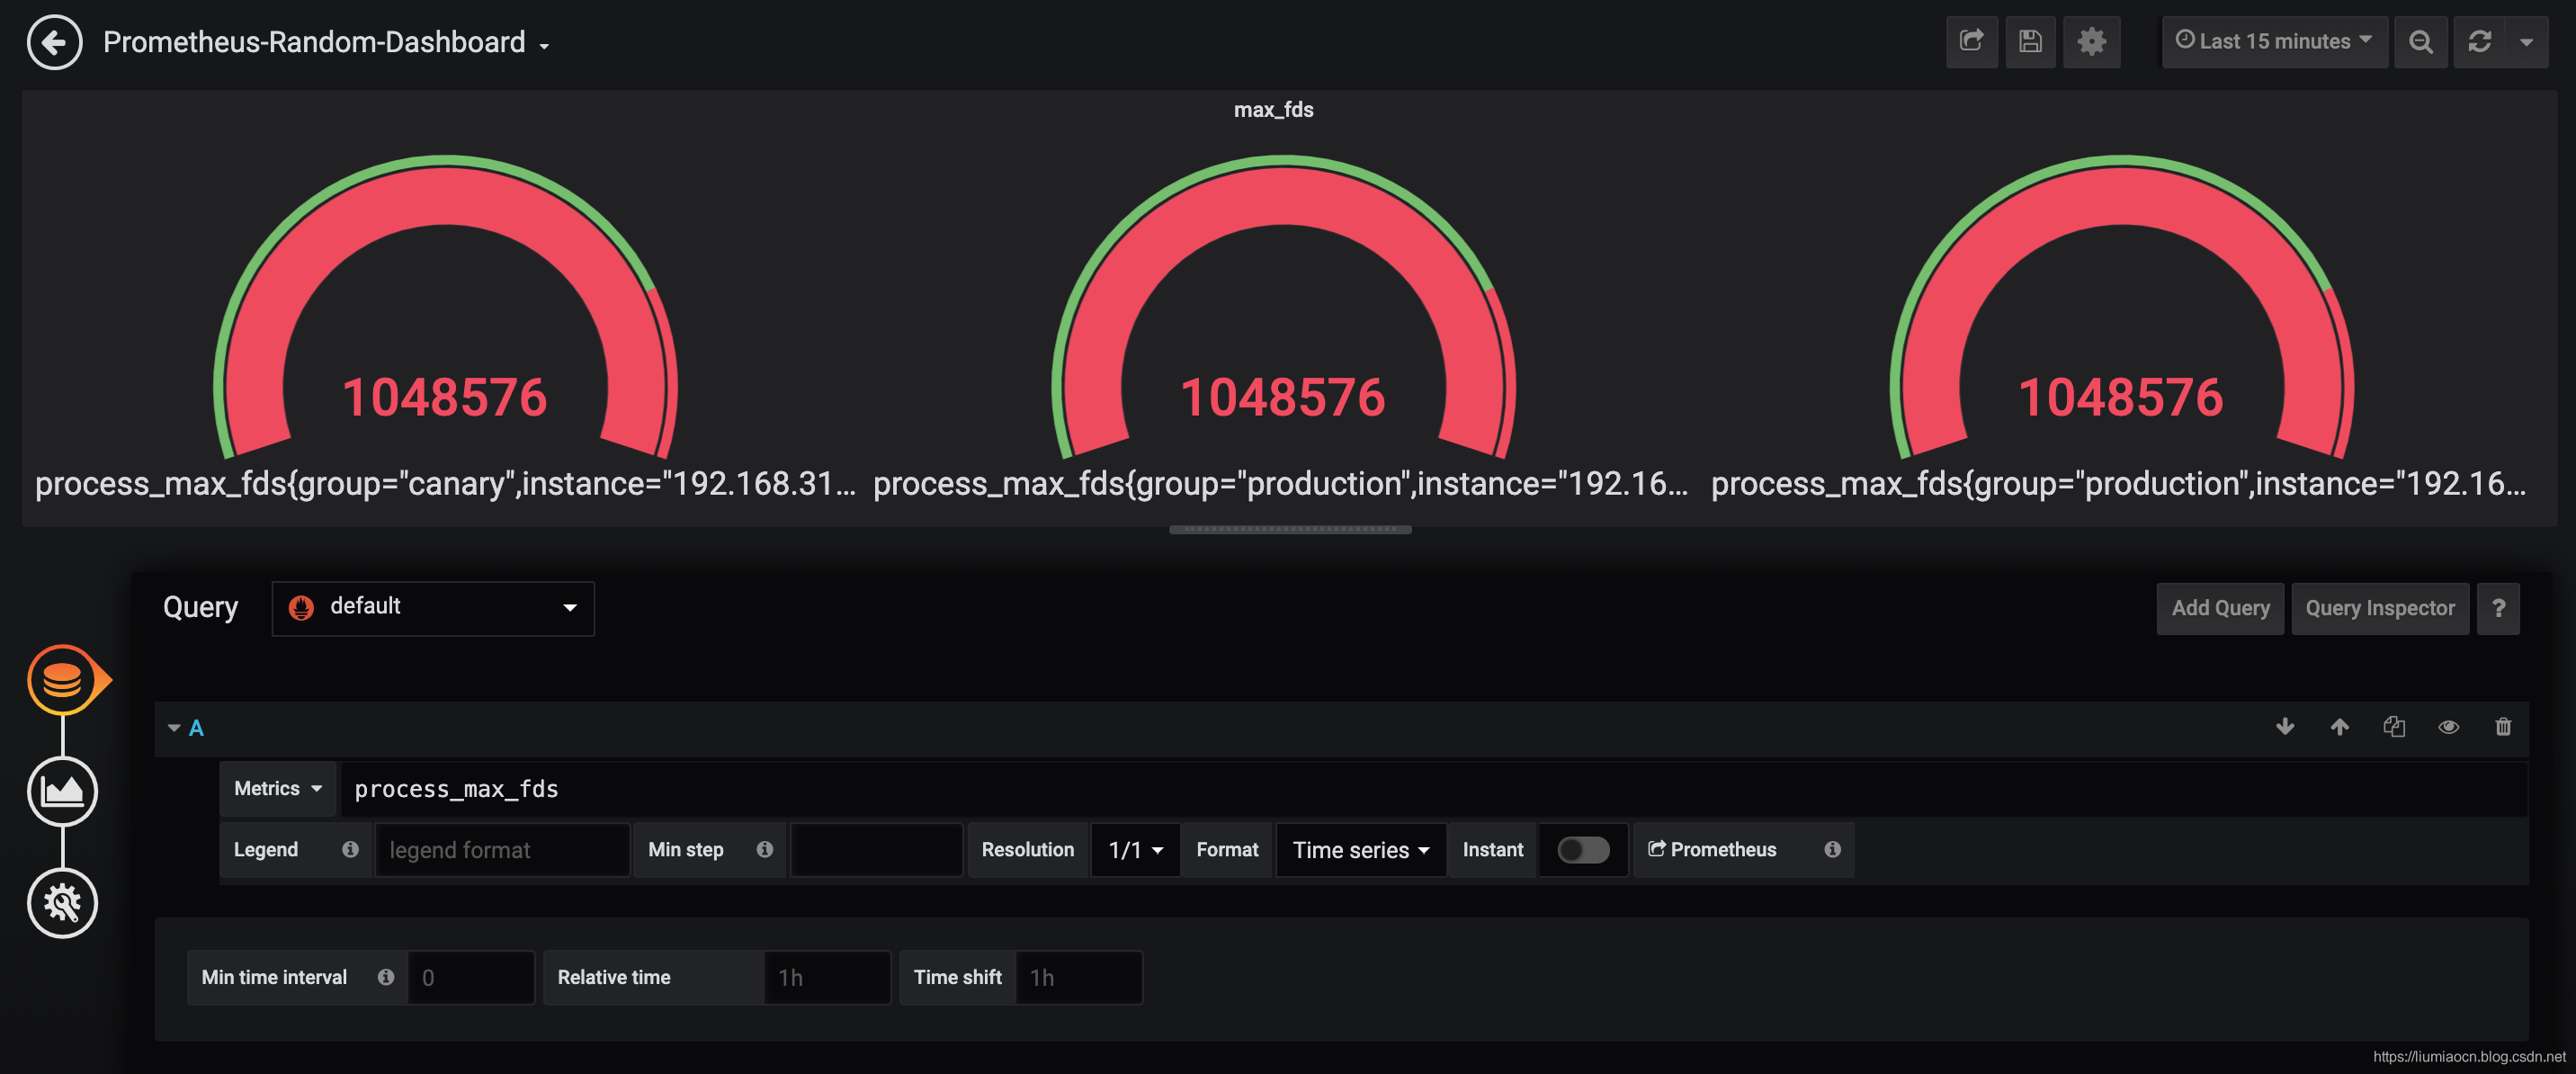
- 然后使用相同的步骤再添加两个指标进行设定和显示,
<!--  -->
<!--  -->
- 此时自定义的仪表盘已经变成了这样
<!-- 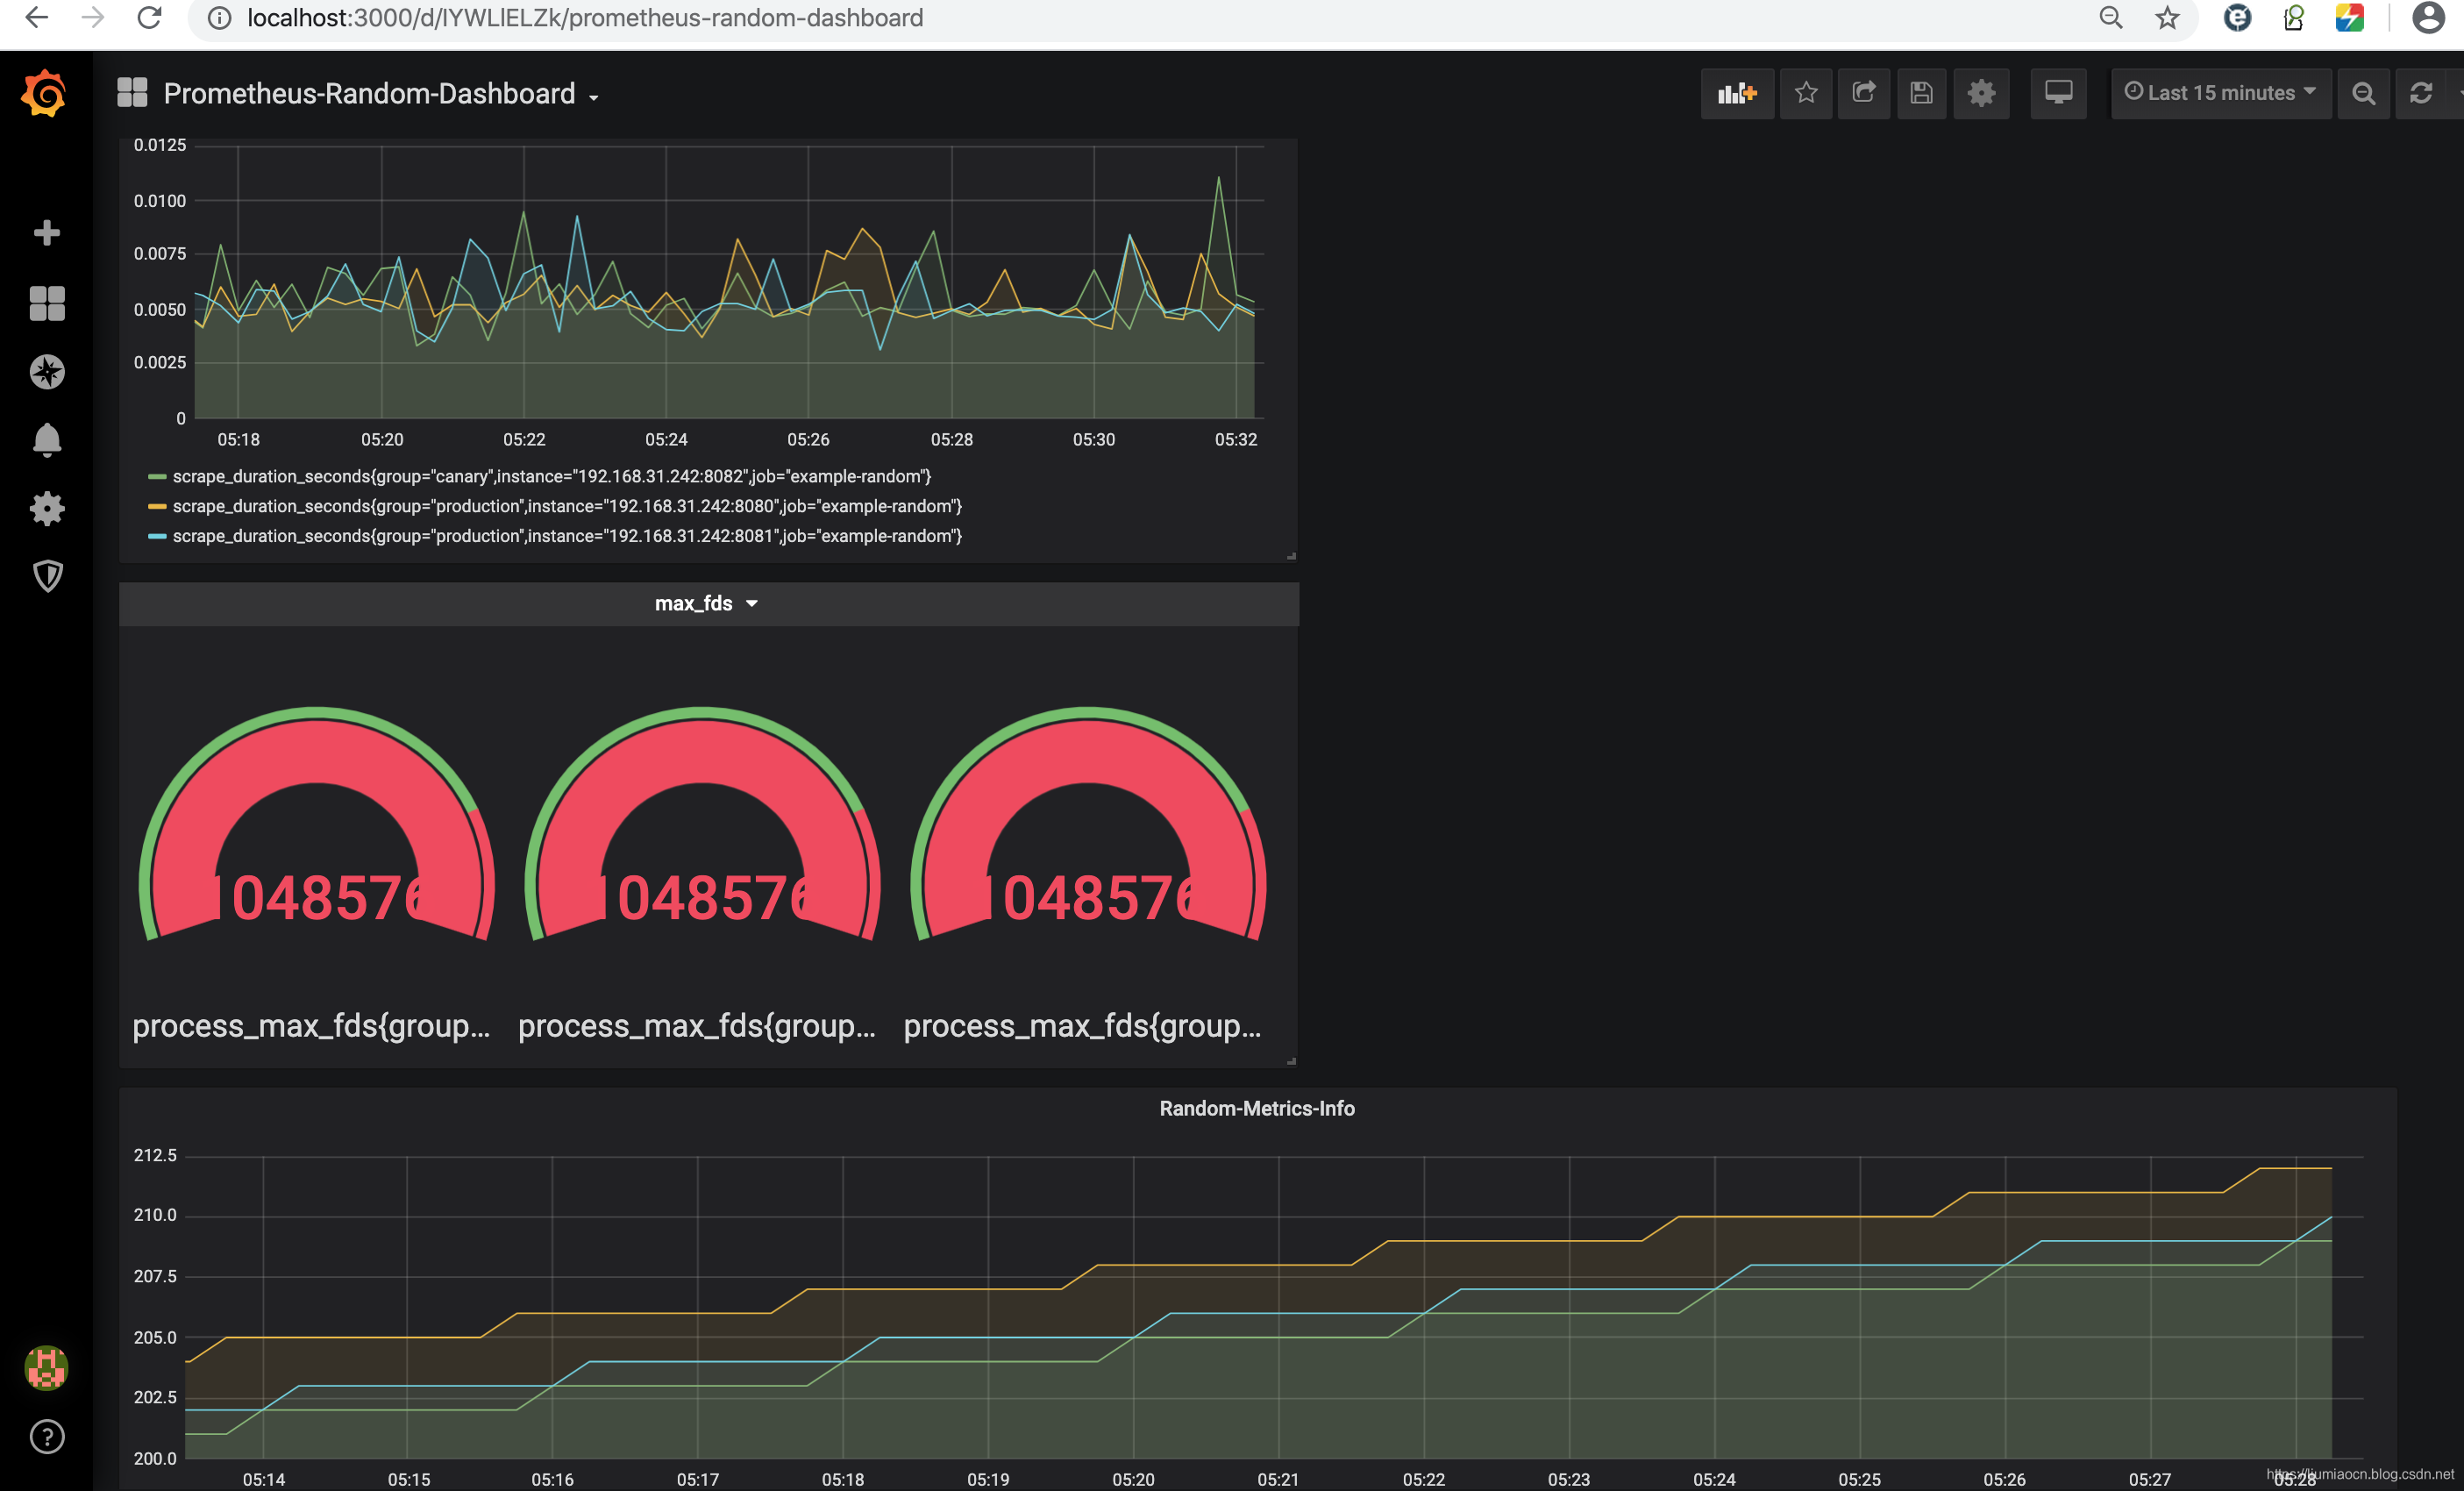 -->
- 可以进行随意拖拽和调整大小与位置,比如可以调整成这样
<!--  -->
5:在Kubernetes上部署
Prometheus安装方法
- 在Kubernetes上直接部署Prometheus也非常简单,
- 使用ConfigMap管理配置文件,然后使用卷方式挂载,
- 然后创建Deployment和Service即可使用了。
事前准备
1
2
3
kubectl get node -o wide
# NAME              STATUS   ROLES    AGE   VERSION   INTERNAL-IP       EXTERNAL-IP   OS-IMAGE                KERNEL-VERSION          CONTAINER-RUNTIME
# 192.168.163.131   Ready    <none>   20h   v1.17.0   192.168.163.131   <none>        CentOS Linux 7 (Core)   3.10.0-957.el7.x86_64   docker://18.9.7
步骤1: 创建ConfigMap
1
2
3
4
5
6
7
8
9
10
11
12
13
14
15
16
17
18
19
20
21
22
23
24
25
26
27
28
29
30
31
32
33
34
35
36
37
38
39
40
41
42
43
44
# 创建Prometheus使用的ConfigMap配置,所使用的yaml文件如下所示
# prometheus.yml
apiVersion: v1
kind: ConfigMap
metadata:
  name: prometheus-configmap
  namespace: default
data:
  prometheus.yml: |
    global:
      scrape_interval:     10s
      evaluation_interval: 10s
    scrape_configs:
      - job_name: 'prometheus'
        static_configs:
        - targets: ['localhost:9090']


# 创建并确认ConfigMap配置
kubectl create -f prometheus.yml
# configmap/prometheus-configmap created

kubectl get cm
# NAME                   DATA   AGE
# prometheus-configmap   1      4s
kubectl describe cm prometheus-configmap
# Name:         prometheus-configmap
# Namespace:    default
# Labels:       <none>
# Annotations:  <none>

# Data
# ====
# prometheus.yml:
# ----
# global:
#   scrape_interval:     10s
#   evaluation_interval: 10s
# scrape_configs:
#   - job_name: 'prometheus'
#     static_configs:
#     - targets: ['localhost:9090']

# Events:  <none>
步骤2: 创建Service与Deployment
- 首先准备如下的yaml文件,包含了Prometheus所需的Deployment和Service的配置
1
2
3
4
5
6
7
8
9
10
11
12
13
14
15
16
17
18
19
20
21
22
23
24
25
26
27
28
29
30
31
32
33
34
35
36
37
38
39
40
41
42
43
44
45
46
47
48
49
50
51
52
prometheus-deployment.yml
    ---
    apiVersion: v1
    kind: "Service"
    metadata:
      name: prometheus
      labels:
        name: prometheus
    spec:
      ports:
      - name: prometheus
        protocol: TCP
        port: 9090
        targetPort: 9090
      selector:
        app: prometheus
      type: NodePort
    ...
    ---
    apiVersion: apps/v1
    kind: Deployment
    metadata:
      labels:
        name: prometheus
      name: prometheus
    spec:
      replicas: 1
      selector:
        matchLabels:
          app: prometheus
      template:
        metadata:
          labels:
            app: prometheus
        spec:
          containers:
          - name: prometheus
            image: prom/prometheus:v2.15.1
            command:
            - "/bin/prometheus"
            args:
            - "--config.file=/etc/prometheus/prometheus.yml"
            ports:
            - containerPort: 9090
              protocol: TCP
            volumeMounts:
            - mountPath: "/etc/prometheus"
              name: prometheus-configmap
          volumes:
          - name: prometheus-configmap
            configMap:
              name: prometheus-configmap
1
2
3
4
5
6
7
8
9
10
11
12
13
14
15
16
17
# 创建Service与Deployment
kubectl create -f prometheus-deployment.yml
# service/prometheus created
# deployment.apps/prometheus created


# 确认Service信息
kubectl get service -o wide
# NAME         TYPE        CLUSTER-IP       EXTERNAL-IP   PORT(S)          AGE   SELECTOR
# kubernetes   ClusterIP   10.254.0.1       <none>        443/TCP          20h   <none>
# prometheus   NodePort    10.254.229.211   <none>        9090:30944/TCP   7s    app=prometheus


# 确认Pod信息
kubectl get pods
# NAME                         READY   STATUS    RESTARTS   AGE
# prometheus-fcd87fbf4-ljzrb   1/1     Running   0          13s
步骤3: 结果确认
- 在30944端口即可确认刚刚部署的Prometheus的运行状况
Exporter概要介绍
Exporter
- 为Prometheus提供监控数据源的应用都可以被成为Exporter,
- 比如Node Exporter则用来提供节点相关的资源使用状况,而Prometheus从这些不同的Exporter中获取监控数据,然后可以在诸如Grafana这样的可视化工具中进行结果的显示。
Exporter的类型
- Exporter根据来源可以分为:社区提供的Exporter和自定义的Exporter两种
- Exporter根据支持方式可以分为:很多软件现在已经内嵌支持Prometheus,比如kubernetes或者etcd,简单来说这种类型的软件中不需要单独的Exporter用于提供给Prometheus的监控数据的功能,这是其本身的功能特性之一。当然更多的情况则是通过独立运行的Exporter来进行,比如Node Exporter,操作系统本身由于不像kubernetes那样提供对于Prometheus的支持,所以需要单独运行Node Exporter用于提供节点自身的信息给Prometheus进行监控。
社区常见的Exporter
数据库 常见的主流数据库几乎逗留相应的Exporter,详细如下所示:
- MongoDB exporter
- MSSQL server exporter
- MySQL server exporter (official)
- OpenTSDB Exporter
- Oracle DB Exporter
- PostgreSQL exporter
- Redis exporter
- ElasticSearch exporter
- RethinkDB exporter
- Consul exporter (official)
消息队列
- Kafka exporter
- IBM MQ exporter
- RabbitMQ exporter
- RocketMQ exporter
- NSQ exporter
- Gearman exporter
存储
- Ceph exporter
- Gluster exporter
- Hadoop HDFS FSImage exporter
硬件相关
- Node/system metrics exporter (official)
- Dell Hardware OMSA exporter
- IoT Edison exporter
- IBM Z HMC exporter
- NVIDIA GPU exporter
问题追踪与持续集成
- Bamboo exporter
- Bitbucket exporter
- Confluence exporter
- Jenkins exporter
- JIRA exporter
HTTP服务
- Apache exporter
- HAProxy exporter (official)
- Nginx metric library
- Nginx VTS exporter
- Passenger exporter
- Squid exporter
- Tinyproxy exporter
- Varnish exporter
- WebDriver exporter
API服务
- AWS ECS exporter
- AWS Health exporter
- AWS SQS exporter
- Cloudflare exporter
- DigitalOcean exporter
- Docker Cloud exporter
- Docker Hub exporter
- GitHub exporter
- InstaClustr exporter
- Mozilla Observatory exporter
- OpenWeatherMap exporter
- Pagespeed exporter
- Rancher exporter
- Speedtest exporter
- Tankerkönig API Exporter
日志
- Fluentd exporter
- Google’s mtail log data extractor
- Grok exporter
监控系统
- Akamai Cloudmonitor exporter
- Alibaba Cloudmonitor exporter
- AWS CloudWatch exporter (official)
- Azure Monitor exporter
- Cloud Foundry Firehose exporter
- Collectd exporter (official)
- Google Stackdriver exporter
- Graphite exporter (official)
- Huawei Cloudeye exporter
- InfluxDB exporter (official)
- JavaMelody exporter
- JMX exporter (official)
- Nagios / Naemon exporter
- Sensu exporter
- SNMP exporter (official)
- TencentCloud monitor exporter
- ThousandEyes exporter
其他
- BIND exporter
- Bitcoind exporter
- cAdvisor
- Dnsmasq exporter
- Ethereum Client exporter
- JFrog Artifactory Exporter
- JMeter plugin
- Kibana Exporter
- kube-state-metrics
- OpenStack exporter
- PowerDNS exporter
- Script exporter
- SMTP/Maildir MDA blackbox prober
- WireGuard exporter
- Xen exporter
使用方式
- Prometheus Server提供PromQL查询语言能力、负责数据的采集和存储等主要功能,
- 而数据的采集主要通过周期性的从Exporter所暴露出来的HTTP服务地址(一般是/metrics)来获取监控数据。
- 而Exporter在实际运行的时候根据其支持的方式也会分为:
- 独立运行的Exporter应用,通过HTTP服务地址提供相应的监控数据(比如Node Exporter)
- 内置在监控目标中,通过HTTP服务地址提供相应的监控数据(比如kubernetes)
Prometheus 属于 CNCF 项目
- 拥有完整的开源生态,与 Zabbix 这种传统 agent 监控不同,它提供了丰富的 exporter 来满足你的各种需求。
- 你可以在这里看到官方、非官方的 exporter。如果还是没满足你的需求,你还可以自己编写 exporter,简单方便、自由开放,这是优点。Prometheus:https://prometheus.io/docs/instrumenting/exporters/
- 但是过于开放就会带来选型、试错成本。之前只需要在 zabbix agent里面几行配置就能完成的事,现在你会需要很多 exporter 搭配才能完成。还要对所有 exporter 维护、监控。尤其是升级 exporter 版本时,很痛苦。非官方exporter 还会有不少 bug。这是使用上的不足,当然也是 Prometheus 的设计原则。
K8S 生态的组件都会提供/metric接口以提供自监控:
- cadvisor: 集成在 Kubelet 中。
- kubelet: 10255为非认证端口,10250为认证端口。
- apiserver: 6443端口,关心请求数、延迟等。
- scheduler: 10251端口。
- controller-manager: 10252端口。
- etcd: 如etcd 写入读取延迟、存储容量等。
- docker: 需要开启 experimental 实验特性,配置 metrics-addr,如容器创建耗时等指标。
- kube-proxy: 默认 127 暴露,10249端口。外部采集时可以修改为 0.0.0.0 监听,会暴露:写入 iptables 规则的耗时等指标。
- kube-state-metrics: K8S 官方项目,采集pod、deployment等资源的元信息。
- node-exporter: Prometheus 官方项目,采集机器指标如 CPU、内存、磁盘。
- blackbox_exporter: Prometheus 官方项目,网络探测,dns、ping、http监控
- process-exporter: 采集进程指标
- nvidia exporter: 有 gpu 任务,需要 gpu 数据监控
- node-problem-detector: 即 npd,准确的说不是 exporter,但也会监测机器状态,上报节点异常打 taint
- 应用层 exporter: mysql、nginx、mq等,看业务需求。
- cadvisor:https://www.xuyasong.com/?p=1483
- kube-state-metrics:https://www.xuyasong.com/?p=1525
- node-exporter:https://www.xuyasong.com/?p=1539
自定义 exporter:https://www.xuyasong.com/?p=1942
exporter
以下是一个简单的exporter
- 通过http模块指定了一个路径,并将
client_golang库中的promhttp.Handler()作为处理函数传递进去后,就可以获取指标信息了, - 两行代码实现了一个exporter。
- 这里内部其实是使用了一个默认的收集器将通过NewGoCollector采集当前Go运行时的相关信息比如go堆栈使用,goroutine的数据等等。 通过访问https://localhost:8080/metrics 即可查看详细的指标参数。
- 上面的代码仅仅展示了一个默认的采集器,并且通过接口调用隐藏了太多实施细节
1
2
3
4
5
6
7
8
9
10
11
12
13
14
// 下载对应的prometheus包
go get github.com/prometheus/client_golang/prometheus/promhttp

// 程序主函数:
package main
import (
    "log"
    "net/http"
    "github.com/prometheus/client_golang/prometheus/promhttp"
)
func main() {
    http.Handle("/metrics", promhttp.Handler())
    log.Fatal(http.ListenAndServe(":8080", nil))
}
Cadvisor
Cadvisor 的指标兼容问题
在 K8S 1.16版本,Cadvisor 的指标去掉了 pod_Name 和 container_name 的 label,替换为了pod 和 container。
- 注意要用 metric_relabel_configs,不是 relabel_configs,采集后做的replace。
expose custom metrics to Prometheus
ref:
- https://zhimin-wen.medium.com/custom-prometheus-metrics-for-apps-running-in-kubernetes-498d69ada7aa
step
- Develop the custom metrics with Prometheus Client API on a toy app
- Deploy the app into Kubernetes (IBM Cloud Private)
- Configure Prometheus in Kubernetes to scrape the metrics
- Present the result in Grafana dashboard. Especially explore the dashboard for multiple replicas of the pod.
App with metric
- use the Prometheus Golang Client API to provide some custom metrics for a hello world web application.
- The HTTP service is being instrumented with three metrics:
- Total transaction till now, implemented as a Prometheus Counter.
- Currently active client, as a Prometheus Gauge.
- Response time distribution, as a Prometheus Histogram.
1
2
3
4
5
6
7
8
9
10
11
12
13
14
15
16
17
18
19
20
21
22
23
24
25
26
27
28
29
30
31
32
33
34
35
36
37
38
39
40
41
42
43
44
45
46
47
48
49
50
51
52
53
54
55
56
57
58
59
60
61
62
63
64
65
66
67
68
69
70
71
72
73
74
75
76
77
78
79
80
81
82
83
84
85
86
87
package main

import (
	"fmt"
	"log"
	"net/http"
	"os"
	"strconv"
	"time"

	"github.com/prometheus/client_golang/prometheus"
	"github.com/prometheus/client_golang/prometheus/promauto"
	"github.com/prometheus/client_golang/prometheus/promhttp"
)

type PrometheusHttpMetric struct {
	Prefix                string
	ClientConnected       prometheus.Gauge
	TransactionTotal      *prometheus.CounterVec
	ResponseTimeHistogram *prometheus.HistogramVec
	Buckets               []float64
}

func InitPrometheusHttpMetric(prefix string, buckets []float64) *PrometheusHttpMetric {
	phm := PrometheusHttpMetric{
		Prefix: prefix,
		ClientConnected: promauto.NewGauge(prometheus.GaugeOpts{
			Name: prefix + "_client_connected",
			Help: "Number of active client connections",
		}),
		TransactionTotal: promauto.NewCounterVec(prometheus.CounterOpts{
			Name: prefix + "_requests_total",
			Help: "total HTTP requests processed",
		}, []string{"code", "method"},
		),
		ResponseTimeHistogram: promauto.NewHistogramVec(prometheus.HistogramOpts{
			Name:    prefix + "_response_time",
			Help:    "Histogram of response time for handler",
			Buckets: buckets,
		}, []string{"handler", "method"}),
	}

	return &phm
}

func (phm *PrometheusHttpMetric) WrapHandler(handlerLabel string, handlerFunc http.HandlerFunc) http.Handler {
	handle := http.HandlerFunc(handlerFunc)
	wrappedHandler := promhttp.InstrumentHandlerInFlight(phm.ClientConnected,
		promhttp.InstrumentHandlerCounter(phm.TransactionTotal,
			promhttp.InstrumentHandlerDuration(phm.ResponseTimeHistogram.MustCurryWith(prometheus.Labels{"handler": handlerLabel}),
				handle),
		),
	)
	return wrappedHandler
}

func myHandler(w http.ResponseWriter, r *http.Request) {
	cost := r.FormValue("cost")
	val, err := strconv.ParseFloat(cost, 64)
	if err != nil {
		http.Error(w, "Fail to convert cost as float value", 500)
		return
	}

	sleep := time.Duration(val*1e+9) * time.Nanosecond
	time.Sleep(sleep)
	fmt.Fprintf(w, "Time spend for this request: %.2f", sleep.Seconds())
}

func main() {
	phm := InitPrometheusHttpMetric("myapp", prometheus.LinearBuckets(0, 5, 20))

	http.Handle("/metrics", promhttp.Handler())
	http.Handle("/service", phm.WrapHandler("myhandler", myHandler))

	port := os.Getenv("LISTENING_PORT")

	if port == "" {
		port = "8080"
	}
	log.Printf("listening on port:%s", port)

	err := http.ListenAndServe(":"+port, nil)
	if err != nil {
		log.Fatalf("Failed to start server:%v", err)
	}
}
- check it
1
2
3
4
5
6
7
8
9
10
11
12
13
14
15
16
# test run it with some random curl command to populate the Prometheus metrics
$ curl localhost:8080/service?cost=0.2
Time spend for this request: 0.20


# check the metrics by accessing the URL and grepping only the prefix of `myapp`
$ curl localhost:8080/metrics | grep myapp
# HELP myapp_client_connected Number of active client connections
# TYPE myapp_client_connected gauge
myapp_client_connected 0.0
# HELP myapp_requests_total total HTTP requests processed
# TYPE myapp_requests_total counter
myapp_requests_total{code="200",method="get"} 1.0
# HELP myapp_response_time Histogram of response time for handler
# TYPE myapp_response_time histogram
myapp_response_time_bucket{handler="myhandler",method="get",le="0.0"} 0.0
Deploy into Kubernetes
1
2
3
4
5
6
7
8
9
10
11
12
13
14
15
16
17
18
# Use the multi-stage build Dockerfile to build the docker image.
FROM golang:alpine AS builder
RUN apk update && apk add --no-cache git
COPY src $GOPATH/src/zhiminwen/hpasimulator
WORKDIR $GOPATH/src/zhiminwen/hpasimulator
RUN go get -d -v
RUN go build -o /tmp/simulator *.go

FROM alpine
RUN addgroup -S appgroup && adduser -S appuser -G appgroup && mkdir -p /app
COPY --from=builder /tmp/simulator /app
RUN chmod a+rx /app/simulator

USER appuser
WORKDIR /app
ENV LISTENING_PORT 8080

CMD ["./simulator"]
1
2
3
4
5
6
7
8
9
10
11
12
13
14
15
16
17
18
19
20
21
22
23
24
25
26
27
28
29
30
31
32
33
34
35
36
37
38
39
40
---
apiVersion: v1
kind: Service
metadata:
  name: hpa-sim
  labels:
    app: hpa-sim
spec:
  type: NodePort
  ports:
  - port: 80
    targetPort: 8080
    protocol: TCP
    name: http
  selector:
    app: hpa-sim
---
apiVersion: apps/v1
kind: Deployment
metadata:
  name: hpa-sim
  labels:
    app: hpa-sim
spec:
  replicas: 1
  selector:
    matchLabels:
      app: hpa-sim
  template:
    metadata:
      labels:
        app: hpa-sim
    spec:
      containers:
      - name: hpa-sim
        image: zhiminwen/hpa-sim:v1
        imagePullPolicy: IfNotPresent
        env:
          - name: LISTENING_PORT
            value: "8080"
Scrape Metrics from Prometheus
- Prometheus using the pull method to bring in the metrics.
- Need to configure Prometheus to scrape the app for the custom metrics.
couple of ways to scrape the custom metrics:
- use the default
kubernetes-podsjob which will scape the pod that has the annotation of
1
2
3
prometheus.io/scrape: true for enabling the scraping
prometheus.io/path: If the metrics path is not `/metrics` override this.
prometheus.io/port: Specify the non-default port other than 9090
- Updating the Prometheus config YAML file.
- to have more control over the scraping job on the frequency and labeling.
- create a dedicate job for the custom metrics.
1
2
3
kubectl get cm monitoring-prometheus \
  -n kube-system \
  -o jsonpath='{.data.prometheus\.yml }' > prom.yaml
1
2
3
4
5
6
7
8
9
10
11
12
13
14
15
16
17
18
19
20
21
22
23
24
25
  - job_name: hpa-sim
    scrape_interval: 10s
    kubernetes_sd_configs:
      - role: pod
    static_configs:
      - targets:
        - "hpa-sim.default:80"
    relabel_configs:
      - source_labels: [__meta_kubernetes_pod_label_app]
        action: keep
        regex: hpa-sim

      - source_labels: [__address__]
        action: replace
        target_label: __address__
        regex: ([^:]+)(?::\d+)?
        replacement: ${1}:8080

      - source_labels: [__meta_kubernetes_namespace]
        action: replace
        target_label: k8s_namespace

      - source_labels: [__meta_kubernetes_pod_name]
        action: replace
        target_label: k8s_pod_name
static_configs
- In terms of the target, one way is to use a static config
kubernetes_sd_configs
- Prometheus is running inside the cluster
- Prometheus can reach the app using its service name.
- However, the scraping will be managed by the load balancing mechanism of the K8s service.
- If there are multiple pods running, not all the pods are scrapped.
- use the dynamic discovery feature for Kubernetes in Prometheus.
- Set the role for kubernetes_sd_configs as
pod. - So the
scrape will target all the Kubernetes podsthat match the following criteria,
- Set the role for kubernetes_sd_configs as
relabel_configs
This means Prometheus will
- before the actual scraping, we relabel the
__address__- to let it point to the container port for the handler, port 8080.
ignore all the pods that don’t regex match tohpa-sim`` for the label ofapp.- Effectively, it
only scrapes the pods that labeled withapp=hpa-sim``.
- Effectively, it
assign two extra labelsfor the Prometheus metrics- namely the namespace and the pod name instead of setting those labels inside the code.
delete the old configMap and create it again to achieve the effect of updating.
1
2
3
4
5
kubectl delete cm monitoring-prometheus \
  -n kube-system
kubectl create cm monitoring-prometheus \
  -n kube-system \
  --from-file=prometheus.yml=prom.yaml
1
2
curl https://192.168.0.226:8080/service?cost=0.2
curl https://192.168.0.226:8080/metrics | grep myapp
Metric
标签管理
- Prometheus 在处理数据指标的过程中,包括【抓取的生命周期】和【标签的生命周期】。
- 默认情况下,当 Prometheus加载 Target 实例完成后,这些Target时候都会包含一些默认的标签:这些标签将会告诉Prometheus如何从该Target实例中获取监控数据。

标签配置
Prometheus通过标签可以实现查询过滤,并且还支持重新标签实现动态生成标签、过滤、删除无用标签等灵活配置。
- 在采集数据之前可以使用relabel_configs进行重新标记,
- 存储数据之前可以使用metric_relabel_configs重新标记。
两种重新打标签的方式都支持以下动作:
- replace:默认动作,将匹配到的标签内容做替换
- keep:通过正则匹配,仅保留正则匹配到的标签
- drop:通过正则匹配,删除正则匹配到的标签
- labeldrop:删除指定标签,比如一些默认标签并不需要,可以用该动作删除
- labelkeep:仅保留指定标签
CONFIGURATION
https://prometheus.io/docs/prometheus/latest/configuration/configuration/
https://prometheus.io/docs/prometheus/latest/configuration/configuration/#kubernetes_sd_config
scrape_config:
- A scrape_config section specifies a set of targets and parameters describing how to scrape them.
In the general case, one scrape configuration specifies a single job. In advanced configurations, this may change.
Targetsmay be statically configured via thestatic_configsparameter or dynamically discovered using one of the supportedservice-discoverymechanisms.- Additionally,
relabel_configsallow advanced modifications to any target and its labels before scraping.
metric_relabel_configs
Prometheus 从数据源拉取数据后,会对原始数据进行编辑
其中 metric_relabel_configs是 Prometheus 在保存数据前的最后一步标签重新编辑(relabel_configs)。
- 所以哪怕将 metric_relabel_configs模块放在 job_name模块的最前端,Prometheus 解析编辑文件后,也会将 metric_relabel_configs放在最后。
metric_relabel_configs 模块和 relabel_config 模块很相似。
metric_relabel_configs一个很常用的用途:将监控不需要的数据,直接丢掉,不在Prometheus 中保存。
- 删除不必要的指标。
- 从指标中删除敏感或不需要的标签。
- 添加、编辑或者修改指标的标签值或者标签格式。
- 一个用处是屏蔽太昂贵的时序数据;
删除不需要的指标(metric)
- prometheus 默认会将所有拉取到的 metrics 都写入自己的存储中。
- 如果某些 metrics 对并没有太多意义,可以设置直接丢掉,减少磁盘空间的浪费。
- ‘node_netstat_Icmp_OutMsgs’ 指标数据。
1
2
3
4
  metric_relabel_configs:
   - source_labels: [ __name__ ]
     regex: 'node_netstat_Icmp_OutMsgs'
     action: drop
使用 source_labels 参数选择要要操作的指标,并且还需要一组标签名称。
- 示例中使用
__name__标签,此标签是标识指标名称的预留标签。 - 参考上面的配置,可以对指标(metric) 进行添加,删除,重命名等操作。
修改指标(metric) 中的标签(label)
- 如果使用 prometheus 监控 Kubernetes 运行状态;应该会遇到,在一个 query 中结合一个以上的
job_name(metric_source)的情况。 - 不同的 job_name 中 metric 的 label 命名可能不相同。
- 比如:pod的名称可以使用
pod或者pod_name这两个 label 记录。 - 如果相同含义的label,名称却不相同;对query的编写就很困难了。
- 没有在PromQL 中找到类似 SQL 语句中的 as 的功能的关键词和方法。
- 比如:pod的名称可以使用
- 这样的话,正确的解决思路应该是
- 在 Prometheus 拉取数据后,保存数据前;
- 将 label 的名称进行重写;
- 保证相同含义的label 有相同的名称。
1
2
3
4
5
6
7
8
9
10
11
12
13
metric_relabel_configs:
  - source_labels: [pod]
    action: replace
    regex: (.+)
    separator: ;
    replacement: $1
    target_label: pod_name
  - source_labels: [container]
    action: replace
    separator: ;
    regex: (.+)
    replacement: $1
    target_label: container_name
- 如上,将指定 job_name 中,所有的 metrics 中含有名为
pod和container名称的 label 分别拷贝到名为pod_name,container_name的label中。 - 注意:如果metric 的 label的名称包含了
pod和container关键词,但是不等于;则不会处理此label。
删除标签
- 删除标签通常用于隐藏敏感信息或者简化时间序列。
1
2
3
  metric_relabel_configs:
  - regex: 'kernelVersion'
    action: labeldrop
- 为了删除标签,指定了一个正则表达式,然后指定删除标签的操作labeldrop。
- 这将删除与正在表达式匹配的所有标签。
1
2
3
4
5
6
7
8
9
10
11
12
13
14
15
16
17
18
19
20
21
22
23
24
25
26
27
28
29
30
31
32
33
34
35
36
37
38
39
40
41
42
43
44
45
46
47
48
49
50
51
52
53
54
55
56
57
58
59
# 查询指标
curl 'https://localhost:9090/api/v1/query?' --data-urlencod 'query=prometheus_engine_queries_concurrent_max'
# {
# 	"status": "success",
# 	"data": {
# 		"resultType": "vector",
# 		"result": [{
# 			"metric": {
# 				"Label": "value1",
# 				"__name__": "prometheus_engine_queries_concurrent_max",
# 				"instance": "localhost:9090",
# 				"job": "prometheus",
# 				"userLabel1": "value1",
# 				"userLabel2": "value2"
# 			},
# 			"value": [1587829220.743, "20"]
# 		}]
# 	}
# }


# 删除指标的标签
global:
  scrape_interval:     15s
  evaluation_interval: 15s
alerting:
  alertmanagers:
  - static_configs:
    - targets:
rule_files:
scrape_configs:
  - job_name: 'prometheus'
    static_configs:
      - targets: ['localhost:9090']
        labels:
          userLabel1: value1
          userLabel2: value2
    metric_relabel_configs:
      - regex: userLabel1
        action: labeldrop


# 重载配置后查询
curl 'https://localhost:9090/api/v1/query?' --data-urlencod 'query=prometheus_engine_queries_concurrent_max'
# {
# 	"status": "success",
# 	"data": {
# 		"resultType": "vector",
# 		"result": [{
# 			"metric": {
# 				"__name__": "prometheus_engine_queries_concurrent_max",
# 				"instance": "localhost:9090",
# 				"job": "prometheus",
# 				"userLabel2": "value2" //删除了userLabel1标签
# 			},
# 			"value": [1587829524.788, "20"]
# 		}]
# 	}
# }
relabel_config
relabel_config 发生在采集之前,metric_relabel_configs 发生在采集之后,合理搭配可以满足很多场景的配置。
- relabel_configs drop动作,那么将不会收集这个指标。
- metric_relabel_configs 使用的时候指标已经采集过了
- 所以metric_relabel_configs相对来说,更加昂贵,毕竟指标已经采集了。
- metric_relabel_configs还可以不用指定source_labels
monitoring with Prometheus
client
Package prometheus is the core instrumentation package.
- It provides metrics primitives to instrument code for monitoring.
- It also offers a registry for metrics.
- Sub-packages allow to expose the registered metrics via HTTP (package promhttp) or push them to a Pushgateway (package push).
- There is also a sub-package promauto, which provides metrics constructors with automatic registration.
- All exported functions and methods are safe to be used concurrently unless specified otherwise.
Instrumenting applications
- The prometheus directory contains the instrumentation library.
- See the guide on the Prometheus website to learn more about instrumenting applications.
- For comprehensive API documentation, see the GoDoc for Prometheus’ various Go libraries.
In this guide, you created two sample Go applications that expose metrics to Prometheus
- one that exposes only the default Go metrics
- and one that also exposes a custom Prometheus counter and configured a Prometheus instance to scrape metrics from those applications.
This documentation is open-source. Please help improve it by filing issues or pull requests.
Installation
- install the
prometheus,promauto, andpromhttplibraries necessary for the guide usinggo get:
1
2
3
4
5
6
7
# create go.mod


# run
go get github.com/prometheus/client_golang/prometheus
go get github.com/prometheus/client_golang/prometheus/promauto
go get github.com/prometheus/client_golang/prometheus/promhttp
How Go exposition works
- To expose Prometheus metrics in a Go application, you need to provide a
/metricsHTTP endpoint. - You can use the
prometheus/promhttplibrary’s HTTPHandleras the handler function.
1
2
3
4
5
6
7
8
9
10
11
12
13
14
15
16
17
// This minimal application, for example, would expose the default metrics for Go applications via `https://localhost:2112/metrics:
package main
import (
	"net/http"

	"github.com/prometheus/client_golang/prometheus/promhttp"
)
func main() {
	http.Handle("/metrics", promhttp.Handler())
	http.ListenAndServe(":2112", nil)
}

// To start the application:
go run main.go

// To access the metrics:
curl https://localhost:2112/metrics
Add own metrics
- The application above exposes only the default Go metrics.
- You can also register your own custom application-specific metrics.
1
2
3
4
5
6
7
8
9
10
11
12
13
14
15
16
17
18
19
20
21
22
23
24
25
26
27
28
29
30
31
32
33
34
35
36
37
38
39
40
41
42
43
// This example application exposes a `myapp_processed_ops_total` [counter](/docs/concepts/metric_types/#counter) that counts the number of operations that have been processed thus far.
// Every 2 seconds, the counter is incremented by one.
package main

import (
	"net/http"
	"time"

	"github.com/prometheus/client_golang/prometheus"
	"github.com/prometheus/client_golang/prometheus/promauto"
	"github.com/prometheus/client_golang/prometheus/promhttp"
)

func recordMetrics() {
	go func() {
		for {
			opsProcessed.Inc()
			time.Sleep(2 * time.Second)
		}
	}()
}

var (
	opsProcessed = promauto.NewCounter(
		prometheus.CounterOpts{
			Name: "myapp_processed_ops_total",
			Help: "The total number of processed events",
		})
)

func main() {
	recordMetrics()

	http.Handle("/metrics", promhttp.Handler())
	http.ListenAndServe(":2112", nil)
}


// To start the application:
go run main.go

// To access the metrics:
curl https://localhost:2112/metrics
In the metrics output, you’ll see the help text, type information, and current value of the myapp_processed_ops_total counter:
1
2
3
// # HELP myapp_processed_ops_total The total number of processed events
// # TYPE myapp_processed_ops_total counter
// myapp_processed_ops_total 5
configure a locally running Prometheus instance to scrape metrics from the application. Here’s an example prometheus.yml configuration:
1
2
3
4
5
6
scrape_configs:
    - job_name: myapp
      scrape_interval: 10s
      static_configs:
      - targets:
        - localhost:2112
Other Go client features
In this guide we covered just a small handful of features available in the Prometheus Go client libraries. You can also expose other metrics types, such as
- gauges
- and histograms,
- non-global registries,
- functions for pushing metrics to Prometheus PushGateways
- bridging Prometheus and Graphite, and more.
The examples directory contains simple examples of instrumented code.
Client for the Prometheus HTTP API
The api/prometheus directory contains the client for the Prometheus HTTP API. It allows you to write Go applications that query time series data from a Prometheus server. It is still in alpha stage.
go client
模型
Prometheus 所有采集的监控数据均以指标(metric)的形式保存在内置的时间序列数据库当中(TSDB):
- 属于同一指标名称,同一标签集合的、有时间戳标记的数据流。
- 除了存储的时间序列,Prometheus 还可以根据查询请求产生临时的、衍生的时间序列作为返回结果。
- 在时间序列中的每一个点称为一个样本(sample)
样本由以下三部分组成
- 指标(metric):指标名称和描述当前样本特征的 labelsets
- 时间戳(timestamp):一个精确到毫秒的时间戳
- 样本值(value): 一个 folat64 的浮点型数据表示当前样本的值
metric 指标
四种类型有实现的函数赋值,常用
1
2
set()
WithLabelValues().set()
1
2
3
4
5
6
7
8
9
metrics name {(label)key-value} float64 value

# HELP go_gc_duration_seconds A summary of the GC invocation durations.
# TYPE go_gc_duration_seconds summary
go_gc_duration_seconds{quantile="0.5"} 0.000107458
go_gc_duration_seconds_count 18
# HELP go_goroutines Number of goroutines that currently exist.
# TYPE go_goroutines gauge
go_goroutines 107
prometheus 包为了方便client library的使用提供了四种数据类型:
Counter,Gauge,Histogram和Summary.- 但这些类型只是在客户端库(客户端可以根据不同的数据类型调用不同的 API 接口)和在线协议中,
- 实际在 Prometheus server 中并不对指标类型进行区分,而是简单地把这些指标统一视为无类型的时间序列。
Prometheus docs, 对这四种度量标准类型的更全面的描述.
除了四种基本的数据指标类型外, Prometheus 数据模型的一个非常重要的部分是沿着称为 标签 的维度对数据指标样本进行划分,这就产生了数据指标向量(metric vectors).
数据指标类型
数据类型:
Counter
- 收集事件次数等单调递增的数据
- 好比计数器,用于统计类似于:CPU时间,API访问总次数,异常发生次数等等场景.
- 代表一种样本数据单调递增的指标,即只增不减。除非监控系统发生了重置。
- 例如,使用 counter 类型的指标来表示服务的请求数、已完成的任务数、错误发生的次数等。
- 不要将 counter 类型应用于样本数据非单调递增的指标,例如:当前运行的进程数量(应该用 Gauge 类型)。
Gauge
- 收集当前的状态,可增可减,比如数据库连接数
计量器仪表盘- 代表一种样本数据可以任意变化的指标,即可增可减。
- Gauge 通常用于像温度或者内存使用率这种指标数据,也可以表示能随时增加或减少的
总数, - 例如:当前并发请求的数量。
Histogram
- 收集随机正态分布数据,比如响应延迟
- 柱状图,更多的是用于统计一些数据分布的情况,用于计算在一定范围内的分布情况,同时还提供了度量指标值的总和.
- 在大多数情况下人们都倾向于使用某些量化指标的平均值,例如 CPU 的平均使用率、页面的平均响应时间。
- 这种方式的问题很明显
- 以系统 API 调用的平均响应时间为例:
- 如果大多数 API 请求都维持在 100ms 的响应时间范围内,而个别请求的响应时间需要 5s,
- 那么就会导致某些 WEB 页面的响应时间落到中位数的情况,而这种现象被称为长尾问题。
- 为了区分是平均的慢还是长尾的慢,最简单的方式就是按照请求延迟的范围进行分组。例如
- 统计延迟在 0~10ms 之间的请求数有多少而 10~20ms 之间的请求数又有多少。
- 通过这种方式可以快速分析系统慢的原因。
- 这种方式的问题很明显
- Histogram
- 在一段时间范围内对数据进行采样(通常是请求持续时间或响应大小等),
- 并将其计入可配置的存储桶(bucket)中,
- 后续可通过指定区间筛选样本,也可以统计样本总数,
- 最后一般将数据展示为直方图。
- Histogram 类型的样本会提供三种指标(假设指标名称为
<metrices_name>):- 样本的值分布在 bucket 中的数量
- 命名为
<metrices_name>_bucket{le=`<上边界>`}。 - 解释的更通俗易懂一点,这个值表示指标值小于等于上边界的所有样本数量。
- 请求响应时间 <=0.005 秒 的请求次数。
- 命名为
- 所有样本值的大小总和
- 命名为
<metrices_name>_sum - 所有请求响应时间总和
- 命名为
- 样本总数
- 命名为
<metrices_name>_count。 - 值和
<metrices_name>_bucket{le=`+Inf`}相同。 - 所有请求次数
- 命名为
- 样本的值分布在 bucket 中的数量
Summary
- 收集随机正态分布数据,和 Histogram 是类似的
- 和Histogram柱状图比较类似,主要用于计算在一定时间窗口范围内度量指标对象的总数以及所有对量指标值的总和.
- 与 Histogram 类型类似,用于表示一段时间内的数据采样结果(通常是请求持续时间或响应大小等)
- 但它直接存储了分位数(通过客户端计算,然后展示出来),而不是通过区间来计算。
- Summary 类型的样本也会提供三种指标(假设指标名称为 ):
- 样本值的分位数分布情况
- 命名为
<metrices_name>{quantile=`0.5`} - 请求中有 50% 的请求响应时间值是
- 命名为
- 所有样本值的大小总和
- 命名为
<metrices_name>_sum - 所有请求响应时间总和
- 命名为
- 样本总数
- 命名为
<metrices_name>_count - 请求的总数
- 命名为
- 样本值的分位数分布情况
Histogram 与 Summary 的异同:
- Histogram 和 Summary 都是为了能够解决这样问题的存在,通过 Histogram 和 Summary 类型的监控指标,可以快速了解监控样本的分布情况。
- 它们都包含了
<metrices_name>_sum和<metrices_name>_count指标 - Histogram 需要通过
<metrices_name>_bucket来计算分位数,而 Summary 则直接存储了分位数的值。
简单理解就是
- Counter对数据只增不减,
- Gauage可增可减,
- Histogram,Summary提供跟多的统计信息。
pro将所有数据保存为timeseries data,用 metric name 和 label 区分
- label 是在 metric name 上的更细维度的划分
- 其中的每一个实例是由一个float64和timestamp组成
- 只不过timestamp是隐式加上去的,有时候不会显示出来
- 如下面所示
go_gc_duration_seconds是 metrics namequantile="0.5"是 key-value pair 的 label- 而后面的值是 float64 value
- 注释部分
# TYPE go_gc_duration_seconds summary标识出这是一个summary对象。
1
2
3
4
5
6
7
8
9
10
11
12
metrics name {(label)key-value} float64 value

# HELP go_gc_duration_seconds A summary of the GC invocation durations.
# TYPE go_gc_duration_seconds summary
go_gc_duration_seconds{quantile="0.5"} 0.000107458
go_gc_duration_seconds{quantile="0.75"} 0.000200112
go_gc_duration_seconds{quantile="1"} 0.000299278
go_gc_duration_seconds_sum 0.002341738
go_gc_duration_seconds_count 18
# HELP go_goroutines Number of goroutines that currently exist.
# TYPE go_goroutines gauge
go_goroutines 107
数据指标向量
每种标准数据结构还对应了 Vec 结构
- 分别是
CounterVec,GaugeVec,HistogramVec和SummaryVec. - 通过 Vec 可以简洁的定义一组相同性质的 Metric,在采集数据的时候传入一组自定义的 Label/Value 获取具体的 Metric(Counter/Gauge/Histogram/Summary),最终都会落实到基本的数据结构上
数据指标向量的方法如下:
1
2
3
4
5
6
7
8
9
10
11
Collect(ch chan<- Metric)  // 实现 Collector 接口的 Collect() 方法
CurryWith(labels Labels)  // 返回带有指定标签的向量指标及可能发生的错误.多用于 promhttp 包中的中间件.
Delete(labels Labels)  // 删除带有指定标签的向量指标.如果删除了指标,返回 true
DeleteLabelValues(lvs ...string)  // 删除带有指定标签和标签值的向量指标.如果删除了指标,返回 true
Describe(ch chan<- *Desc)  // 实现 Collector 接口的 Describe() 方法
GetMetricWith(labels Labels)  // 返回带有指定标签的数据指标及可能发生的错误
GetMetricWithLabelValues(lvs ...string)  // 返回带有指定标签和标签值的数据指标及可能发生的错误
MustCurryWith(labels Labels)  // 与 CurryWith 相同,但如果出现错误,则引发 panics
Reset()  // 删除此指标向量中的所有数据指标
With(labels Labels)  // 与 GetMetricWithLabels 相同,但如果出现错误,则引发 panics
WithLabelValues(lvs ...string)  // 与 GetMetricWithLabelValues 相同,但如果出现错误,则引发 panics
要创建 Metrics 及其向量版本的实例
- 您需要一个合适的
…Opts结构,即GaugeOpts,CounterOpts,SummaryOpts或HistogramOpts.
结构体如下:
1
2
3
4
5
6
7
8
9
10
11
12
13
14
15
16
17
18
19
20
21
22
23
24
25
26
27
28
29
30
31
32
33
34
35
36
37
38
39
40
41
42
43
44
45
46
47
48
49
50
51
52
53
type Opts struct {
    // Namespace, Subsystem, and Name  是 Metric 名称的组成部分
	// (通过 "_" 将这些组成部分连接起来),只有 Name 是必需的.
    Namespace string
    Subsystem string
    Name      string
    // Help 提供 Metric 的信息.具有相同名称的 Metric 必须具有相同的 Help 信息
    Help string
    // ConstLabels 用于将固定标签附加到该指标.很少使用.
    ConstLabels Labels
}

// 其中 GaugeOpts, CounterOpts 实际上均为 Opts 的别名
type CounterOpts Opts
type GaugeOpts Opts

type HistogramOpts struct {
    // Namespace, Subsystem, and Name  是 Metric 名称的组成部分
	// (通过 "_" 将这些组成部分连接起来),只有 Name 是必需的.
    Namespace string
    Subsystem string
    Name      string
    //  Help 提供 Metric 的信息.具有相同名称的 Metric 必须具有相同的 Help 信息
    Help string
    // ConstLabels 用于将固定标签附加到该指标.很少使用.
    ConstLabels Labels
    // Buckets 定义了观察值的取值区间.切片中的每个元素值都是区间的上限,元素值必须按升序排序.
    // Buckets 会隐式添加 `+Inf` 值作为取值区间的最大值
    // 默认值是 DefBuckets =  []float64{.005, .01, .025, .05, .1, .25, .5, 1, 2.5, 5, 10}
    Buckets []float64
}

type SummaryOpts struct {
    // Namespace, Subsystem, and Name  是 Metric 名称的组成部分
	// (通过 "_" 将这些组成部分连接起来),只有 Name 是必需的.
    Namespace string
    Subsystem string
    Name      string
    //  Help 提供 Metric 的信息.具有相同名称的 Metric 必须具有相同的 Help 信息
    Help string
    // ConstLabels 用于将固定标签附加到该指标.很少使用.
    ConstLabels Labels
    // Objectives 定义了分位数等级估计及其各自的绝对误差.
	// 如果 Objectives[q] = e,则 q 报告的值将是 [q-e, q + e]之间某个 φ 的 φ 分位数
    // 默认值为空 map,表示没有分位数的摘要
    Objectives map[float64]float64
    // MaxAge 定义观察值与摘要保持相关的持续时间.必须是正数.默认值为 DefMaxAge = 10 * time.Minute
    MaxAge time.Duration
    // AgeBuckets 用于从摘要中排除早于 MaxAge 的观察值的取值区间.默认值为 DefAgeBuckets = 5
    AgeBuckets uint32
    // BufCap 定义默认样本流缓冲区大小.默认值为 DefBufCap = 500.
    BufCap uint32
}
注意:
Counter,Gauge,Histogram,Summary都继承了Metric和Collector接口,其本身是接口类型.CounterVec,GaugeVec,HistogramVec,SummaryVec均继承自metricVec结构体,其本身的是结构体,而它们只实现了Collector接口.
Counter 和 Gauge
- Gauge 和 Counter 基本实现上看是一个进程内共享的浮点数,基于 value 结构实现,而 Counter 和 Gauge 仅仅封装了对这个共享浮点数的各种操作和合法性检查逻辑。
Histogram
- Histogram 实现了 Observer 接口,用来获取客户端状态初始化(重启)到某个时间点的采样点分布,监控数据常需要服从正态分布。
Summary
- Summary 是标准数据结构中最复杂的一个,用来收集服从正态分布的采样数据。
- 在 Go 客户端 Summary 结构和 Histogram 一样,都实现了 Observer 接口
state metric 定义指标
1
2
3
4
5
6
7
8
9
10
11
12
13
14
15
16
17
18
19
20
21
22
23
// 引入另一个依赖库
go get github.com/prometheus/client_golang/prometheus

// 下面先来定义了两个指标数据,一个是Guage类型, 一个是Counter类型。分别代表了CPU温度和磁盘失败次数统计,使用上面的定义进行分类。
cpuTemp = prometheus.NewGauge(
  prometheus.GaugeOpts{
    Name: "cpu_temperature_celsius",
    Help: "Current temperature of the CPU.",}
)
hdFailures = prometheus.NewCounterVec(
  prometheus.CounterOpts{
    Name: "hd_errors_total",
    Help: "Number of hard-disk errors.",
  },
  []string{"device"},
)
totalScrapes= prometheus.NewCounter(
  prometheus.CounterOpts{
    Namespace: namespace,
    Name:      "exporter_scrapes_total",
    Help:      "Current total redis scrapes.",}
)
// 这里还可以注册其他的参数,比如上面的磁盘失败次数统计上,可以同时传递一个device设备名称进去,这样采集的时候就可以获得多个不同的指标。每个指标对应了一个设备的磁盘失败次数统计。
registry metric 注册指标
默认方式
1
2
3
4
5
6
7
8
9
10
11
12
13
14
15
16
17
18
19
//statement
ABC := prometheus.NewGaugeVec(
  prometheus.GaugeOpts{
    Name: zz,
    Help: zz,
  },
  zz{zzz}
)
ABC := prometheus.NewGauge(
  prometheus.GaugeOpts{
    Name: zz,
    Help: zz,
})


ABC.With(prometheus.Labels{"zz":zz,}).Set(zz)
ABC.Set(zz)
// Metrics have to be registered to be exposed:
prometheus.MustRegister(ABC)
prometheus.MustRegister()
- 使用prometheus.MustRegister是将数据直接注册到Default Registry
- 这个Default Registry不需要额外的任何代码就可以将指标传递出去。
- 注册后既可以在程序层面上去使用该指标了,这里使用之前定义的指标提供的API(Set和With().Inc)去改变指标的数据内容
1
2
3
4
5
6
7
8
9
10
11
12
13
14
15
16
17
18
19
20
21
22
23
24
25
26
27
28
29
30
31
32
33
34
35
36
37
38
39
40
41
42
43
44
45
46
var {
  //statement
  proxyTodayTrafficIn := prometheus.NewGaugeVec(
    prometheus.GaugeOpts{
        Name: "",
        Help: "The today trafficin of proxy.",
    },
    []string{"type","laststarttime","lastclosetime"}
  )

  serverBindPort := prometheus.NewGauge(prometheus.GaugeOpts{
      Name: "frps_server_bind_port",
      Help: "The port of server frps.",
  })
}

//registry
func init() {
  // Metrics have to be registered to be exposed:
  prometheus.MustRegister(proxyTodayTrafficIn)
  prometheus.MustRegister(serverBindPort)
  prometheus.MustRegister(cpuTemp)
  prometheus.MustRegister(hdFailures)
}

//get value
func main() {

  proxyTodayTrafficIn.With(
    prometheus.Labels{
      "type":v.Type,
      "laststarttime":v.LastStartTime,
      "lastclosetime":v.LastCloseTime
    }
  ).Set(float64(v.TodayTrafficIn))

  serverBindPort.Set(float64(cfg.BindPort))

  cpuTemp.Set(65.3)
  hdFailures.With(prometheus.Labels{"device":"/dev/sda"}).Inc()

  // The Handler function provides a default handler to expose metrics
  // via an HTTP server. "/metrics" is the usual endpoint for that.
  http.Handle("/metrics", promhttp.Handler())
  log.Fatal(http.ListenAndServe(":8080", nil))
}
Set()
With().Inc()
- With函数是传递到之前定义的label=”device”上的值,也就是生成指标类似于
1
2
cpu_temperature_celsius 65.3
hd_errors_total{"device"="/dev/sda"} 1
当然main函数中的方式是有问题的, 这样这个指标仅仅改变了一次,不会随着下次采集数据的时候发生任何变化, 希望的是每次执行采集的时候,程序都去自动的抓取指标并将数据通过http的方式传递给。
自定义 exporter / 结构体
下面就涉及到自定义结构体,
- 根据上面的原理,需要重自定义的结构体中获取到两个结构体的值
- counter数据采集实例,重写collecter
- 下面是一个采集Counter类型数据的实例,
- 实现了一个自定义的,满足采集器(Collector)接口的结构体
- 并手动注册该结构体后,使其每次查询的时候自动执行采集任务。
1
2
3
4
5
6
7
8
9
10
11
12
13
14
15
16
17
18
19
20
21
22
23
24
25
26
27
28
29
30
31
32
33
34
35
36
37
38
39
40
41
42
43
44
45
46
47
48
49
50
51
52
53
54
55
56
57
58
59
60
61
62
63
64
65
66
67
68
69
70
71
72
73
74
75
76
77
78
79
80
81
82
83
84
85
86
87
88
89
90
91
92
93
94
95
96
97
98
99
100
101
102
103
104
105
106
107
108
109
110
111
112
113
114
115
116
117
118
119
120
121
122
123
124
125
126
127
128
129
130
131
132
133
134
135
136
137
138
139
140
141
142
143
144
145
146
147
148
149
150
151
152
153
154
155
// 采集器Collector接口的实现
type Collector interface {
    // 用于传递所有可能的指标的定义描述符
    // 可以在程序运行期间添加新的描述,收集新的指标信息
    // 重复的描述符将被忽略。两个不同的Collector不要设置相同的描述符
    Describe(chan<- *Desc)

    // Prometheus的注册器调用Collect执行实际的抓取参数的工作,
    // 并将收集的数据传递到Channel中返回
    // 收集的指标信息来自于Describe中传递,可以并发的执行抓取工作,但是必须要保证线程的安全。
    Collect(chan<- Metric)
}


// 了解了接口的实现后,就可以写自己的实现了
// 先定义 结构体
// 这是一个集群的指标采集器,每个集群都有自己的Zone, 代表集群的名称。
// 另外两个是保存的采集的指标。
type ClusterManager struct {
    Zone         string
    OOMCountDesc *prometheus.Desc
    RAMUsageDesc *prometheus.Desc
}


// 创建结构体及对应的指标信息
// NewDesc参数:
// 第一个为指标的名称,
// 第二个为帮助信息,显示在指标的上面作为注释,
// 第三个是定义的label名称数组,
// 第四个是定义的Labels
func NewClusterManager(zone string) *ClusterManager {
    return &ClusterManager{
        Zone: zone,
        OOMCountDesc: prometheus.NewDesc(
            "clustermanager_oom_crashes_total",
            "Number of OOM crashes.",
            []string{"host"},
            prometheus.Labels{"zone": zone},
        ),
        RAMUsageDesc: prometheus.NewDesc(
            "clustermanager_ram_usage_bytes",
            "RAM usage as reported to the cluster manager.",
            []string{"host"},
            prometheus.Labels{"zone": zone},
        ),
    }
}

// 实现一个采集工作,放到了 ReallyExpensiveAssessmentOfTheSystemState 函数中实现,
// 每次执行的时候,返回一个按照主机名作为键采集到的数据
// 两个返回值分别代表了 OOM错误计数,和RAM使用指标信息。
func (c *ClusterManager) ReallyExpensiveAssessmentOfTheSystemState() (
    oomCountByHost map[string]int, ramUsageByHost map[string]float64,
) {
    oomCountByHost = map[string]int{
        "foo.example.org": int(rand.Int31n(1000)),
        "bar.example.org": int(rand.Int31n(1000)),
    }
    ramUsageByHost = map[string]float64{
        "foo.example.org": rand.Float64() * 100,
        "bar.example.org": rand.Float64() * 100,
    }
    return
}


// Collect函数将执行抓取函数并返回数据,
// 返回的数据传递到channel中,并且传递的同时绑定原先的指标描述符。以及指标的类型(一个Counter和一个Guage)
func (c *ClusterManager) Collect(ch chan<- prometheus.Metric) {
    oomCountByHost, ramUsageByHost := c.ReallyExpensiveAssessmentOfTheSystemState()
    for host, oomCount := range oomCountByHost {
        ch <- prometheus.MustNewConstMetric(
            c.OOMCountDesc, // 指标描述符
            prometheus.CounterValue, // 指标类型
            float64(oomCount), host,
        )
    }
    for host, ramUsage := range ramUsageByHost {
        ch <- prometheus.MustNewConstMetric(
            c.RAMUsageDesc,
            prometheus.GaugeValue,
            ramUsage, host,
        )
    }
}
// 实现Describe接口,传递指标描述符到channel
// Describe simply sends the two Descs in the struct to the channel.
func (c *ClusterManager) Describe(ch chan<- *prometheus.Desc) {
    ch <- c.OOMCountDesc
    ch <- c.RAMUsageDesc
}


// 执行主程序
func main() {
    workerDB := NewClusterManager("db")
    workerCA := NewClusterManager("ca")

    // Since we are dealing with custom Collector implementations, it might
    // be a good idea to try it out with a pedantic registry.
    reg := prometheus.NewPedanticRegistry()
    reg.MustRegister(workerDB)
    reg.MustRegister(workerCA)

    // 如果直接执行上面的参数的话,不会获取任何的参数,
    // 因为程序将自动推出,我们并未定义http接口去暴露数据出来,
    // 因此数据在执行的时候还需要定义一个httphandler来处理http请求。


    // prometheus.Gatherers用来定义一个采集数据的收集器集合,
    // 可以merge多个不同的采集数据到一个结果集合,
    // 这里我们传递了缺省的 DefaultGatherer ,所以他在输出中也会包含go运行时指标信息。
    // 同时包含reg是我们之前生成的一个注册对象,用来自定义采集数据。
    gatherers := prometheus.Gatherers{
        prometheus.DefaultGatherer,
        reg,
    }

    // promhttp.HandlerFor()函数
    // 传递之前的Gatherers对象,并返回一个httpHandler对象,
    // 这个httpHandler对象可以调用其自身的ServHTTP函数来接手http请求,并返回响应。
    // 其中 promhttp.HandlerOpts 定义了采集过程中如果发生错误时,继续采集其他的数据。
    h := promhttp.HandlerFor(
        gatherers,
        promhttp.HandlerOpts{
            ErrorLog:      log.NewErrorLogger(),
            ErrorHandling: promhttp.ContinueOnError,
        })

    http.HandleFunc("/metrics", func(w http.ResponseWriter, r *http.Request) {
        h.ServeHTTP(w, r)
    })

    log.Infoln("Start server at :8080")

    if err := http.ListenAndServe(":8080", nil); err != nil {
        log.Errorf("Error occur when start server %v", err)
        os.Exit(1)
    }

}

// 尝试刷新几次浏览器获取最新的指标信息
// 每次刷新的时候,我们都会获得不同的数据,类似于实现了一个数值不断改变的采集器。当然,具体的指标和采集函数还需要按照需求进行修改,满足实际的业务需求。
clustermanager_oom_crashes_total{host="bar.example.org",zone="ca"} 364
clustermanager_oom_crashes_total{host="bar.example.org",zone="db"} 90
clustermanager_oom_crashes_total{host="foo.example.org",zone="ca"} 844
clustermanager_oom_crashes_total{host="foo.example.org",zone="db"} 801
# HELP clustermanager_ram_usage_bytes RAM usage as reported to the cluster manager.
# TYPE clustermanager_ram_usage_bytes gauge
clustermanager_ram_usage_bytes{host="bar.example.org",zone="ca"} 10.738111282075208
clustermanager_ram_usage_bytes{host="bar.example.org",zone="db"} 19.003276633920805
clustermanager_ram_usage_bytes{host="foo.example.org",zone="ca"} 79.72085409108028
clustermanager_ram_usage_bytes{host="foo.example.org",zone="db"} 13.041384617379178
2.
1
2
3
4
5
6
7
8
9
10
11
12
13
14
15
16
17
18
19
20
21
22
23
24
25
26
27
28
29
30
31
32
33
34
35
36
37
38
39
40
41
42
43
44
45
46
47
48
49
50
51
52
53
54
55
56
57
58
59
60
61
62
63
64
65
66
67
68
69
70
71
72
73
74
75
76
77
78
79
80
81
82
83
84
85
86
87
88
89
90
91
92
93
94
95
96
97
98
99
100
101
102
103
104
105
106
107
108
109
110
111
112
func (s *结构体) Describe(ch chan<- *prometheus.Desc) {}
// ----可见这个接口的实现需要将prometheus.Desc放倒channel中去

func (s *结构体) Collect(ch chan<- prometheus.Metric) {}
// ----可见这个接口的实现需要将prometheus.Metric放倒channel中去


type Desc struct {
    // fqName has been built from Namespace, Subsystem, and Name.
    fqName string
    // help provides some helpful information about this metric.
    help string
    // constLabelPairs contains precalculated DTO label pairs based on
    // the constant labels.
    constLabelPairs []*dto.LabelPair
    // VariableLabels contains names of labels for which the metric
    // maintains variable values.
    variableLabels []string
    // id is a hash of the values of the ConstLabels and fqName. This
    // must be unique among all registered descriptors and can therefore be
    // used as an identifier of the descriptor.
    id uint64
    // dimHash is a hash of the label names (preset and variable) and the
    // Help string. Each Desc with the same fqName must have the same
    // dimHash.
    dimHash uint64
    // err is an error that occurred during construction. It is reported on
    // registration time.
    err error
}

type Metric interface {
    // Desc returns the descriptor for the Metric. This method idempotently
    // returns the same descriptor throughout the lifetime of the
    // Metric. The returned descriptor is immutable by contract. A Metric
    // unable to describe itself must return an invalid descriptor (created
    // with NewInvalidDesc).
    Desc() *Desc
    // Write encodes the Metric into a "Metric" Protocol Buffer data
    // transmission object.
    //
    // Metric implementations must observe concurrency safety as reads of
    // this metric may occur at any time, and any blocking occurs at the
    // expense of total performance of rendering all registered
    // metrics. Ideally, Metric implementations should support concurrent
    // readers.
    //
    // While populating dto.Metric, it is the responsibility of the
    // implementation to ensure validity of the Metric protobuf (like valid
    // UTF-8 strings or syntactically valid metric and label names). It is
    // recommended to sort labels lexicographically. (Implementers may find
    // LabelPairSorter useful for that.) Callers of Write should still make
    // sure of sorting if they depend on it.
    Write(*dto.Metric) error
    // TODO(beorn7): The original rationale of passing in a pre-allocated
    // dto.Metric protobuf to save allocations has disappeared. The
    // signature of this method should be changed to "Write() (*dto.Metric,
    // error)".
}


// 如何获取这两种值

// 首先desc,每种数据类型都有一个desc函数可以直接获取,如下:
name := fmt.Sprintf("%s_%s", namespace, metricMaps.Name)
gaugeDescription := prometheus.NewGauge(
    prometheus.GaugeOpts{
        Name:      name,
        Help:      metricMaps.Description,
    },
)
ch <- gaugeDescription.Desc()

// 还可以直接新建 new desc
func NewDesc(fqName, help string, variableLabels []string, constLabels Labels) *Desc {}
desc := prometheus.NewDesc(name, metricMaps.Description, constLabels, nil)


// 再来看看metrics这个接口,找到其相应的结构体实现

func MustNewConstMetric(
  desc *Desc, valueType ValueType, value float64, labelValues ...string) Metric {}

//channel
ch <- prometheus.MustNewConstMetric(desc, vtype, value, labelValue...)


第三种


// 新建结构体,完成上面方法的使用,就可以了,如下:
//set var
name := fmt.Sprintf("%s_%s", namespace, metricMaps.Name)
log.Debugf("counter name: %s", name)

//deal Value
value, err := dealValue(res[i])
if err != nil {
    log.Errorf("parse value error: %s",err)
    break
}
log.Debugf("counter value: %s", value)

//new desc
desc := prometheus.NewDesc(name, metricMaps.Description, constLabels, nil)
vtype := prometheus.CounterValue
//channel
ch <- prometheus.MustNewConstMetric(desc, vtype, value, labelValue...)
Collector
Collector 中 Describe 和 Collect 方法都是无状态的函数
- 其中 Describe 暴露全部可能的 Metric 描述列表,在注册(Register)或注销(Unregister)Collector 时会调用 Describe 来获取完整的 Metric 列表,用以检测 Metric 定义的冲突,另外在 github.com/prometheus/client_golang/prometheus/promhttp 下的 Instrument Handler 中,也会通过 Describe 获取 Metric 列表,并检查 label 列表(InstrumentHandler 中只支持 code 和 method 两种自定义 label);
- 而通过 Collect 可以获取采样数据,然后通过 HTTP 接口暴露给 Prom Server。另外,一些临时性的进程,如批处理任务,可以把数据 push 到 Push Gateway,由 Push Gateway 暴露 pull 接口,此处不赘述。
自定义Collector
- 更高阶的做法是使用Collector,go client Colletor只会在每次响应pro请求的时候才收集数据,并且需要每次显式传递变量的值,否则就不会再维持该变量,在pro也将看不到这个变量,
- Collector是一个接口,所有收集metrics数据的对象都需要实现这个接口,Counter和Gauage等不例外
- 它内部提供了两个函数
- Collector函数用于收集用户数据,将收集好的数据传递给传入参数Channel就可,
- Descirbe函数用于描述这个Collector。
- 当收集系统数据代价较大时,就可以自定义Collector收集的方式,优化流程,
- 如果已经有了一个成熟的metrics,就不需要使用Counter,Gauage等这些数据结构,直接在Collector内部实现一个代理的功能即可
- 一些高阶的用法都可以通过自定义Collector实现。
1
2
3
4
5
6
7
8
9
10
11
12
13
14
15
16
17
18
19
20
21
22
23
24
25
26
27
28
29
30
31
32
33
34
35
36
37
38
39
40
41
42
43
44
45
46
47
48
49
50
51
52
53
54
55
56
57
58
59
60
61
62
63
64
65
66
67
68
69
70
71
72
73
74
75
76
77
78
79
80
81
82
83
84
85
86
87
88
89
90
91
92
93
94
95
96
package main

import (
	"github.com/prometheus/client_golang/prometheus"
	"github.com/prometheus/client_golang/prometheus/promhttp"
	"net/http"
)

type ClusterManager struct {
	Zone         string
	OOMCountDesc *prometheus.Desc
	RAMUsageDesc *prometheus.Desc
	// ... many more fields
}

// Simulate prepare the data
func (c *ClusterManager) ReallyExpensiveAssessmentOfTheSystemState() (
	oomCountByHost map[string]int, ramUsageByHost map[string]float64,
) {
	// Just example fake data.
	oomCountByHost = map[string]int{
		"foo.example.org": 42,
		"bar.example.org": 2001,
	}
	ramUsageByHost = map[string]float64{
		"foo.example.org": 6.023e23,
		"bar.example.org": 3.14,
	}
	return
}

// Describe simply sends the two Descs in the struct to the channel.
func (c *ClusterManager) Describe(ch chan<- *prometheus.Desc) {
	ch <- c.OOMCountDesc
	ch <- c.RAMUsageDesc
}

func (c *ClusterManager) Collect(ch chan<- prometheus.Metric) {
	oomCountByHost, ramUsageByHost := c.ReallyExpensiveAssessmentOfTheSystemState()
	for host, oomCount := range oomCountByHost {
		ch <- prometheus.MustNewConstMetric(
			c.OOMCountDesc,
			prometheus.CounterValue,
			float64(oomCount),
			host,
		)
	}
	for host, ramUsage := range ramUsageByHost {
		ch <- prometheus.MustNewConstMetric(
			c.RAMUsageDesc,
			prometheus.GaugeValue,
			ramUsage,
			host,
		)
	}
}

// NewClusterManager creates the two Descs OOMCountDesc and RAMUsageDesc. Note
// that the zone is set as a ConstLabel. (It's different in each instance of the
// ClusterManager, but constant over the lifetime of an instance.) Then there is
// a variable label "host", since we want to partition the collected metrics by
// host. Since all Descs created in this way are consistent across instances,
// with a guaranteed distinction by the "zone" label, we can register different
// ClusterManager instances with the same registry.
func NewClusterManager(zone string) *ClusterManager {
	return &ClusterManager{
		Zone: zone,
		OOMCountDesc: prometheus.NewDesc(
			"clustermanager_oom_crashes_total",
			"Number of OOM crashes.",
			[]string{"host"},
			prometheus.Labels{"zone": zone},
		),
		RAMUsageDesc: prometheus.NewDesc(
			"clustermanager_ram_usage_bytes",
			"RAM usage as reported to the cluster manager.",
			[]string{"host"},
			prometheus.Labels{"zone": zone},
		),
	}
}

func main() {
	workerDB := NewClusterManager("db")
	workerCA := NewClusterManager("ca")

	// Since we are dealing with custom Collector implementations, it might
	// be a good idea to try it out with a pedantic registry.
	reg := prometheus.NewPedanticRegistry()
	reg.MustRegister(workerDB)
	reg.MustRegister(workerCA)

	http.Handle("/metrics", promhttp.HandlerFor(reg, promhttp.HandlerOpts{}))
	http.ListenAndServe(":8888", nil)
}
此时就可以去https://localhost:8888/metrics 看到传递过去的数据了。
- 示例中定义了两个matrics, host和zone分别是其label。
- pro client内部提供了几个Collector供使用参考
- 在源码包中可以找到go_collector.go, process_collecor.go, expvar_collector这三个文件的Collecor实现。
Package
prometheus/client_golang
prometheus/client_golang 包结构如下:
- api
- api 包提供了 Prometheus HTTP API
- api/prometheus/v1
- v1 包提供了 v1 版本的 Prometheus HTTP API,详见 https://prometheus.io/docs/querying/api/
- examples/random
- 一个简单的示例,将具有不同类型的随机分布(均匀,正态和指数)的虚构 RPC 延迟公开为 Prometheus 数据指标
- examples/simple
- 一个使用 Prometheus 工具的最小示例
- prometheus
- prometheus 包是 prometheus/client_golang 的核心包
- prometheus/graphite
- graphite 包提供了将 Prometheus 数据指标推送到 Graphite 服务的相关代码
- prometheus/internal
- 内部包
- prometheus/promauto
- promauto 包提供了 Prometheus 指标的基本数据类型及其
…Vec和…Func变体数据类型的构造函数
- promauto 包提供了 Prometheus 指标的基本数据类型及其
- prometheus/promhttp
- promhttp 包提供了 HTTP 服务端和客户端相关工具
- prometheus/push
- push 包提供了将指标推送到 Pushgateway 的函数
- prometheus/testutil
- testutil 包提供了测试使用 prometheus/client_golang 编写的代码的帮助程序
- prometheus/testutil/promlint
- promlint 包为 Prometheus 数据指标提供一个参考.
prometheus 包
导入方式 import "github.com/prometheus/client_golang/prometheus" .
prometheus包是 prometheus/client_golang 的核心包.- 它为工具代码提供原生数据指标用于监控,并为数据指标对象提供了注册表.
promauto为数据指标提供自动注册的构造函数,promhttp子包允许通过 HTTP 公开已注册的数据指标,push子包可以将已注册的数据指标推送到 Pushgateway.
1
2
3
4
5
6
7
8
9
10
11
12
13
14
15
16
17
18
19
20
21
22
23
24
25
26
27
28
29
30
31
32
33
34
35
36
37
38
39
40
package main
import (
    "log"
    "net/http"

    "github.com/prometheus/client_golang/prometheus"
    "github.com/prometheus/client_golang/prometheus/promhttp"
)

var (
    // 通过 NewGauge() 方法创建 Gauge 接口的实现对象
    cpuTemp = prometheus.NewGauge(
		prometheus.GaugeOpts{
			Name: "cpu_temperature_celsius",
			Help: "Current temperature of the CPU.",
		})
    // 通过 NewCounterVec() 方法创建带"标签"的 CounterVec 对象
    hdFailures = prometheus.NewCounterVec(
        prometheus.CounterOpts{
            Name: "hd_errors_total",
            Help: "Number of hard-disk errors.",
        },
        []string{"device"},
    )
)

func init() {
    // Metrics 数据指标必须被注册后才会被公开
    prometheus.MustRegister(cpuTemp)
    prometheus.MustRegister(hdFailures)
}

func main() {
    cpuTemp.Set(65.3)
    hdFailures.With(prometheus.Labels{"device":"/dev/sda"}).Inc()

    // Handler 函数提供了默认的处理程序,以便通过 HTTP 服务公开指标.通常使用 "/metrics" 作为入口点.
    http.Handle("/metrics", promhttp.Handler())
    log.Fatal(http.ListenAndServe(":8080", nil))
}
自定义 Collectors 和常量指标
prometheus 包提供了 NewConstMetric(), NewConstHistogram(), NewConstSummary() 及其各自的 Must… 版本的函数 动态 创建 Metric 实例.
- 其中
NewConstMetric()函数用于创建仅以 float64 数据作为其值的数据指标类型对象,如Counter,Gauge及Untyped特殊类型对象.Metric实例的创建在Collect()方法中进行.
prometheus 包提供了 NewDesc() 函数创建用于描述以上 Metric 实例的 Desc 对象,其中主要包含 Metric 实例的名称与帮助信息.
prometheus 包还提供了 NewCounterFunc(), NewGaugeFunc() 或 NewUntypedFunc() 函数用于创建实现了 CounterFunc, GaugeFunc, UntypedFunc 接口的 valueFunc 对象,用于只需要以传入函数的浮点数返回值作为数据指标值创建数据指标的场景.
Registry 的高级用法
prometheus 包提供了 MustRegister() 函数用于注册 Collector ,但如果注册过程中发生错误,程序会引发 panics.而使用 Register() 函数可以实现注册 Collector 的同时处理可能发生的错误.
prometheus 包中所有的注册都是在默认的注册表上进行的,可以在全局变量 DefaultRegisterer 中找到该对象. prometheus 包提供了 NewRegistry() 函数用于创建自定义注册表,甚至可以自己实现 Registerer 或 Gatherer 接口.
prometheus 通过 NewGoCollector() 和 NewProcessCollector() 函数创建 Go 运行时数据指标的 Collector 和进程数据指标的 Collector .而这两个 Collector 已在默认的注册表 DefaultRegisterer 中注册.使用自定义注册表,您可以控制并自行决定要注册的 Collector .
HTTP 公开数据指标
注册表( Registry 结构体)实现了 Gatherer 接口,实现了 Gather() 方法. Gather() 方法的调用者可以以某种方式公开收集的数据指标.通常通过 /metrics 入口以 HTTP 方式提供.通过 HTTP 公开数据指标的工具在 promhttp 包中.
推送数据指标到 Pushgateway
在 push 子包中可以找到用于推送到 Pushgateway 的函数.
promauto 包
导入方式: import "github.com/prometheus/client_golang/prometheus/promauto"
promauto包提供了 Prometheus 指标的基本数据类型及其…Vec和…Func变体数据类型的构造函数.与prometheus包中提供的构造函数不同的是,promauto包中的构造函数返回已经注册的Collector对象.promauto包中包含三组构造函数,New<Metric>,New<Metric>Vec与New<Metric>Func.promauto包中NewXXX函数,其实都是调用了prometheus包中对应的NewXXX函数创建了Collector对象,并将此Collector对象在prometheus.DefaultRegisterer中调用MustRegister()方法注册- .因此如果注册失败,所有构造函数都会引发
panics.
以 promauto.NewCounter() 为例,源代码如下:
1
2
3
4
5
6
7
8
9
10
11
12
13
14
// github.com/prometheus/client_golang@v1.7.1/prometheus/promauto/auto.go#L167
func NewCounter(opts prometheus.CounterOpts) prometheus.Counter {
    return With(prometheus.DefaultRegisterer).NewCounter(opts)

func (f Factory) NewCounter(opts prometheus.CounterOpts) prometheus.Counter {
	// 调用 prometheus 包中对应方法,创建 Counter 实现对象
    c := prometheus.NewCounter(opts)
    if f.r != nil {
		// 调用 `prometheus.DefaultRegisterer.MustRegister()` 方法对 Counter 进行注册
        f.r.MustRegister(c)
    }
	// 返回已注册的 Counter 实现对象
    return c
}
示例如下:
1
2
3
4
5
6
7
8
9
10
11
12
13
14
15
16
17
18
19
20
21
22
23
24
// 通过 `promauto` 包中方法创建的 Collector 对象 histogramRegistered 已被注册,
// 可直接被公开为数据指标
var histogramRegistered = promauto.NewHistogram(
    prometheus.HistogramOpts{
        Name:    "random_number_registered",
        Help:    "A histogram of normally distributed random numbers.",
        Buckets: prometheus.LinearBuckets(-3, .1, 61),
    },
)

// 通过 `prometheus` 包中方法创建的 Collector 对象 histogramNotRegistered 没有被注册
// 需要手动进行注册才被公开为数据指标
var histogramNotRegistered = prometheus.NewHistogram(
    prometheus.HistogramOpts{
        Name:    "random_number_not_registered",
        Help:    "A histogram of normally distributed random numbers.",
        Buckets: prometheus.LinearBuckets(-3, .1, 61),
    },
)

// 在 `init()` 函数中对 histogramNotRegistered 对象进行注册
func init() {
    prometheus.Register(histogramNotRegistered)
}
- promauto 包还提供了 With() 函数。
- 该函数返回创建 Collector 的工厂对象。
- 通过该工厂对象创建的 Collector 都在传入的 Registerer 中进行注册.
1
2
3
func With(r prometheus.Registerer) Factory {
	return Factory{r}
}
示例如下:
1
2
3
4
5
6
7
8
9
10
11
12
13
14
15
16
17
18
19
20
21
var (
    reg           = prometheus.NewRegistry()
    factory       = promauto.With(reg) // 使用 reg 定义工厂对象

    // 创建已在 reg 中注册的 histogram 类型的数据对象,该对象实现了 Histogram 接口与 Metric 接口
    randomNumbers = factory.NewHistogram(
		prometheus.HistogramOpts{
			Name:    "random_numbers",
			Help:    "A histogram of normally distributed random numbers.",
			Buckets: prometheus.LinearBuckets(-3, .1, 61),
    })

    // 创建已在 reg 中注册的带有标签的 counter 类型的数据对象,该对象实现了 Collector 接口
    requestCount = factory.NewCounterVec(
        prometheus.CounterOpts{
            Name: "http_requests_total",
            Help: "Total number of HTTP requests by status code and method.",
        },
        []string{"code", "method"},
    )
)
promhttp 包
promhttp 包允许创建 http.Handler 实例通过 HTTP 公开 Prometheus 数据指标.
Handler() 与 HandlerFor() 函数
promhttp 包提供了 Handler() 函数使用默认的 prometheus.DefaultGatherer 返回一个 http.Handler .它将第一个错误报告为 HTTP 错误,没有错误记录.返回的 http.Handler 已使用 InstrumentMetricHandler() 函数和默认的 prometheus.DefaultRegisterer 进行检测.如果调用多个 Handler() 函数创建多个 http.Handler ,则用于检测的数据指标将在它们之间共享,从而提供全局采集计数.如 promhttp_metric_handler_requests_total 和 promhttp_metric_handler_requests_in_flight 数据指标.
promhttp 包提供了 HandlerFor() 函数,您可以为自定义注册表或实现 Gatherer 接口的任何内容创建处理程序,还允许通过传入 HandlerOpts 对象自定义错误处理行为或记录错误的对象.
InstrumentHandlerX 包装器函数
promhttp 包提供了通过中间件来检测 http.Handler 实例的工具.中间件包装器遵循 InstrumentHandlerX 命名方案,其中 X 描述了中间件的预期用途.有关详细信息,请参见每个函数的文档注释.
promhttp 包提供以下中间件包装器:
func InstrumentHandlerCounter(counter *prometheus.CounterVec, next http.Handler) http.HandlerFunc
InstrumentHandlerCounter 包装传入的 http.Handler ,并通过传入的 prometheus.CounterVec 记录不同请求方法或响应状态分组的计数结果.
CounterVec 可以通过 HTTP 状态码或方法对 CounterVec 中带有相应标签实例的数据指标进行分组,其允许的标签名称是 "code" 和 "method" ,否则该函数会引发 panics.对于未分区的计数,可使用不带标签的 CounterVec .如果装饰的 Handler 未设置状态码,默认为 200.
func InstrumentHandlerDuration(obs prometheus.ObserverVec, next http.Handler) http.HandlerFunc
InstrumentHandlerDuration 包装传入的 http.Handler ,并通过传入的 prometheus.ObserverVec 记录不同请求方法或响应状态分组的持续时间.持续时间以秒为单位.
与 CounterVec 类似, ObserverVec 可以通过 HTTP 状态码或方法对 ObserverVec 中带有相应标签实例的数据指标进行分组,其默认允许的标签名称是 "code" 和 "method" ,如果除 method,code 外有其它标签,需要在包装器中调用 CurryWith() 或 MustCurryWith() 传入标签的值,否则该函数会引发 panics.对于未分区的计数,可使用不带标签的 ObserverVec .如果装饰的 Handler 未设置状态码,默认为 200.
func InstrumentHandlerInFlight(g prometheus.Gauge, next http.Handler) http.Handler
InstrumentHandlerInFlight 包装传入的 http.Handler ,它通过传入的 prometheus.Gauge 记录处理的请求数
func InstrumentHandlerRequestSize(obs prometheus.ObserverVec, next http.Handler) http.HandlerFunc
InstrumentHandlerRequestSize 包装传入的 http.Handler ,它通过传入的 prometheus.ObserverVec 记录不同请求方法或响应状态分组的请求大小.请求大小以字节为单位.
与 CounterVec 类似, ObserverVec 可以通过 HTTP 状态码或方法对 ObserverVec 中带有相应标签实例的数据指标进行分组,其默认允许的标签名称是 "code" 和 "method" ,如果除 method,code 外有其它标签,需要在包装器中调用 CurryWith() 或 MustCurryWith() 传入标签的值,否则该函数会引发 panics.对于未分区的计数,可使用不带标签的 ObserverVec .如果装饰的 Handler 未设置状态码,默认为 200.
func InstrumentHandlerResponseSize(obs prometheus.ObserverVec, next http.Handler) http.Handler
InstrumentHandlerResponseSize 包装传入的 http.Handler ,它通过传入的 prometheus.ObserverVec 记录不同请求方法或响应状态分组的响应大小.响应大小以字节为单位.
与 CounterVec 类似, ObserverVec 可以通过 HTTP 状态码或方法对 ObserverVec 中带有相应标签实例的数据指标进行分组,其默认允许的标签名称是 "code" 和 "method" ,如果除 method,code 外有其它标签,需要在包装器中调用 CurryWith() 或 MustCurryWith() 传入标签的值,否则该函数会引发 panics.对于未分区的计数,可使用不带标签的 ObserverVec .如果装饰的 Handler 未设置状态码,默认为 200.
func InstrumentHandlerTimeToWriteHeader(obs prometheus.ObserverVec, next http.Handler) http.HandlerFunc
InstrumentHandlerResponseSize 包装传入的 http.Handler ,它通过传入的 prometheus.ObserverVec 记录不同请求方法或响应状态分组的写入响应头部的时间.持续时间以秒为单位.
与 CounterVec 类似, ObserverVec 可以通过 HTTP 状态码或方法对 ObserverVec 中带有相应标签实例的数据指标进行分组,其默认允许的标签名称是 "code" 和 "method" ,如果除 method,code 外有其它标签,需要在包装器中调用 CurryWith() 或 MustCurryWith() 传入标签的值,否则该函数会引发 panics.对于未分区的计数,可使用不带标签的 ObserverVec .如果装饰的 Handler 未设置状态码,默认为 200.
func InstrumentMetricHandler(reg prometheus.Registerer, handler http.Handler) http.Handler
InstrumentMetricHandler 通常与 HandlerFor 函数返回的 http.Handler 一起使用.它使用两个数据指标为传入的 http.Handler 进行包装: promhttp_metric_handler_requests_total ( CounterVec 类型) 对按 HTTP 响应状态码分组的请求进行计数, promhttp_metric_handler_requests_in_flight ( Gauge 类型) 跟踪同时进行的请求数量.
如上两个数据指标对于查看多少数据指标采集请求发送到监控目标上以及它们的重复率(同时有多少个采集请求)非常有用.
示例
中间件包装器示例如下:
1
2
3
4
5
6
7
8
9
10
11
12
13
14
15
16
17
18
19
20
21
22
23
24
25
26
27
28
29
30
31
32
33
34
35
36
37
38
39
40
41
42
43
44
45
46
47
48
49
50
51
52
53
54
55
56
57
58
59
60
61
62
63
64
65
66
67
68
69
70
71
72
73
74
func main() {
    inFlightGauge := prometheus.NewGauge(
		prometheus.GaugeOpts{
			Name: "in_flight_requests",
			Help: "A gauge of requests currently being served by the wrapped handler.",
    })
    // 带有 "code", "method" 标签的计数器
    counter := prometheus.NewCounterVec(
        prometheus.CounterOpts{
            Name: "api_requests_total",
            Help: "A counter for requests to the wrapped handler.",
        },
        []string{"code", "method"},
    )
    // 带标签的 duration.
	// 如果除 `method,code` 外有其它标签,需要在包装器中调用 `CurryWith()` 或 `MustCurryWith()` 传入标签的值.
    duration := prometheus.NewHistogramVec(
        prometheus.HistogramOpts{
            Name:    "request_duration_seconds",
            Help:    "A histogram of latencies for requests.",
            Buckets: []float64{.25, .5, 1, 2.5, 5, 10},
        },
        []string{"handler", "method"},
    )
    // 不带标签的 responseSize
    responseSize := prometheus.NewHistogramVec(
        prometheus.HistogramOpts{
            Name:    "response_size_bytes",
            Help:    "A histogram of response sizes for requests.",
            Buckets: []float64{200, 500, 900, 1500},
        },
        []string{},
    )

    // 创建将被中间件包装的 Handlers
    pushHandler := http.HandlerFunc(
		func(w http.ResponseWriter, r *http.Request) {w.Write([]byte("Push"))
    })
    pullHandler := http.HandlerFunc(
		func(w http.ResponseWriter, r *http.Request) {w.Write([]byte("Pull"))
    })

    // 在默认的注册表中注册所有的数据指标
    prometheus.MustRegister(inFlightGauge, counter, duration, responseSize)

    // 按照以上定义的数据指标将 Handler 分组,并通过 `ObserverVec` 接口的 `MustCurryWith()` 方法传入 "handler" 标签
    pushChain := promhttp.InstrumentHandlerInFlight(inFlightGauge,
        promhttp.InstrumentHandlerDuration(
			duration.MustCurryWith(prometheus.Labels{"handler": "push"}),
            promhttp.InstrumentHandlerCounter(
				counter,
                promhttp.InstrumentHandlerResponseSize(responseSize, pushHandler),
            ),
        ),
    )
    pullChain := promhttp.InstrumentHandlerInFlight(inFlightGauge,
        promhttp.InstrumentHandlerDuration(
			duration.MustCurryWith(prometheus.Labels{"handler": "pull"}),
            promhttp.InstrumentHandlerCounter(
				counter,
                promhttp.InstrumentHandlerResponseSize(responseSize, pullHandler),
            ),
        ),
    )

    http.Handle("/metrics", promhttp.Handler())
    // 对不同的 HTTP 入口端点请求应用到带有不同标签的 Handler 中间件包装器
    http.Handle("/pull", pullChain)
    http.Handle("/push", pushChain)

    if err := http.ListenAndServe(":3000", nil); err != nil {
        log.Fatal(err)
    }
}
push 包
push包提供了将数据指标推送到 Pushgateway 的函数,- 它使用构造其函数
New()创建Pusher对象,然后使用其实例方法添加各种选项,最后调用Add()或Push()方法向 Pushgateway 推送数据指标.
1
2
3
4
5
6
7
8
9
10
push.New("https://example.org/metrics", "my_job").Gatherer(myRegistry).Push()

// Complex case:
push.New("https://example.org/metrics", "my_job").
    Collector(myCollector1).
    Collector(myCollector2).
    Grouping("zone", "xy").
    Client(&myHTTPClient).
    BasicAuth("top", "secret").
    Add()
源码解析如下:
1
2
3
4
5
6
7
8
9
10
11
12
13
14
15
16
17
18
19
20
21
22
23
24
25
26
27
28
29
30
31
32
33
34
35
36
37
38
39
40
41
42
43
44
45
46
47
48
49
50
51
52
53
54
55
56
57
58
59
60
61
62
63
64
65
66
67
68
69
70
71
72
73
74
75
76
77
78
79
80
81
82
83
84
85
86
87
88
89
90
91
92
93
94
95
96
97
98
99
100
101
102
103
104
105
106
107
108
109
110
111
112
113
114
115
116
117
118
119
120
121
122
123
124
125
126
127
128
129
130
131
132
133
134
135
136
137
138
139
140
141
142
143
144
145
146
147
148
149
150
151
152
153
154
155
156
157
158
159
160
161
162
163
164
165
166
167
168
169
170
171
172
173
174
175
176
177
// github.com/prometheus/client_golang/prometheus/push/push.go
// 定义 Pusher 结构体及构造方法
type Pusher struct {
    error error
    url, job string
    grouping map[string]string
    gatherers  prometheus.Gatherers
    registerer prometheus.Registerer=
    client             HTTPDoer
    useBasicAuth       bool
    username, password string
    expfmt expfmt.Format
}

func New(url, job string) *Pusher {
    var (
        reg = prometheus.NewRegistry()
        err error
    )
    if job == "" {
        err = errJobEmpty
    }
    if !strings.Contains(url, "://") {
        url = "https://" + url
    }
    if strings.HasSuffix(url, "/") {
        url = url[:len(url)-1]
    }
    return &Pusher{
        error:      err,
        url:        url,
        job:        job,
        grouping:   map[string]string{},
        gatherers:  prometheus.Gatherers{reg},
        registerer: reg,
        client:     &http.Client{}, // 使用默认的 HTTP 客户端
        expfmt:     expfmt.FmtProtoDelim, // 默认使用 expfmt.FmtProtoDelim
    }
}

// 添加 Gatherer 对象到 Pusher 中
func (p *Pusher) Gatherer(g prometheus.Gatherer) *Pusher {
    p.gatherers = append(p.gatherers, g)
    return p
}

// 添加 Collector 对象到 Pusher 中
func (p *Pusher) Collector(c prometheus.Collector) *Pusher {
    if p.error == nil {
        p.error = p.registerer.Register(c)
    }
    return p
}

// 对 Pusher 添加键值对分组
func (p *Pusher) Grouping(name, value string) *Pusher {
    if p.error == nil {
        if !model.LabelName(name).IsValid() {
            p.error = fmt.Errorf("grouping label has invalid name: %s", name)
            return p
        }
        p.grouping[name] = value
    }
    return p
}

// 自定义 Pusher 向 Pushgateway 发送请求的 HTTP 客户端
// HTTP 客户端是 `HTTPDoer` 接口的实现类,也就是实现了 `Do(*http.Request)` 方法
// 默认的 http.Client 满足这个要求,因此可以直接使用
func (p *Pusher) Client(c HTTPDoer) *Pusher {
    p.client = c
    return p
}

// BasicAuth 配置 Pusher 使用 HTTP Basic Authentication
func (p *Pusher) BasicAuth(username, password string) *Pusher {
    p.useBasicAuth = true
    p.username = username
    p.password = password
    return p
}

// Format 配置 Pusher 使用 `expfmt.Format` 的编码类型.默认为 `expfmt.FmtProtoDelim`
func (p *Pusher) Format(format expfmt.Format) *Pusher {
    p.expfmt = format
    return p
}

// Pusher 向 Pushgateway 发送 DELETE 请求,删除 URL 下所有数据指标.
func (p *Pusher) Delete() error {
    if p.error != nil {
        return p.error
    }
    req, err := http.NewRequest(http.MethodDelete, p.fullURL(), nil)
    if err != nil {
        return err
    }
    if p.useBasicAuth {
        req.SetBasicAuth(p.username, p.password)
    }
    resp, err := p.client.Do(req)
    if err != nil {
        return err
    }
    defer resp.Body.Close()
    if resp.StatusCode != http.StatusAccepted {
        body, _ := ioutil.ReadAll(resp.Body) // Ignore any further error as this is for an error message only.
        return fmt.Errorf("unexpected status code %d while deleting %s: %s", resp.StatusCode, p.fullURL(), body)
    }
    return nil
}

// Push 从添加到此 Pusher 的所有 Collector 和 Gatherer 收集所有指标,然后使用配置的作业名称和分组标签作为分组键,将指标推送到配置的 Pushgateway
// 具有该作业和其他分组标签的所有先前推送的数据指标将被此调用推送的指标替换.一般用于第一次推送(类似于删除原来推送的数据,后重新推送)
// Push 方法向 Pushgateway 发送 PUT 请求
func (p *Pusher) Push() error {
    return p.push(http.MethodPut)
}

// Add 的工作方式类似于 Push,但只会替换具有相同名称(以及相同的作业和其他分组标签)的先前推送的指标.一般用于后续推送(类似于对此次推送的数据做更新或添加)
// Add 方法向 Pushgateway 发送 POST 请求
func (p *Pusher) Add() error {
    return p.push(http.MethodPost)
}

// github.com/prometheus/client_golang/prometheus/push/push.goL236
func (p *Pusher) push(method string) error {
    if p.error != nil {
        return p.error
    }
    // 这里应该是收集各个注册的 Collector 的数据指标
    mfs, err := p.gatherers.Gather()
    if err != nil {
        return err
    }
    buf := &bytes.Buffer{}
    enc := expfmt.NewEncoder(buf, p.expfmt)
    // Check for pre-existing grouping labels:
    for _, mf := range mfs {
        for _, m := range mf.GetMetric() {
            for _, l := range m.GetLabel() {
                if l.GetName() == "job" {
                    return fmt.Errorf("pushed metric %s (%s) already contains a job label", mf.GetName(), m)
                }
                if _, ok := p.grouping[l.GetName()]; ok {
                    return fmt.Errorf(
                        "pushed metric %s (%s) already contains grouping label %s",
                        mf.GetName(), m, l.GetName(),
                    )
                }
            }
        }
        // 这里应该是将 mf 序列化后写入了请求体 buf
        enc.Encode(mf)
    }
    // 使用 http 包创建新请求,请求使用指定的 方法,URL 与 请求体 buf,并配置请求的各种参数
    req, err := http.NewRequest(method, p.fullURL(), buf)
    if err != nil {
        return err
    }
    if p.useBasicAuth {
        req.SetBasicAuth(p.username, p.password)
    }
    req.Header.Set(contentTypeHeader, string(p.expfmt))
    // 发送请求
    resp, err := p.client.Do(req)
    if err != nil {
        return err
    }
    defer resp.Body.Close()
    // Depending on version and configuration of the PGW, StatusOK or StatusAccepted may be returned.
    if resp.StatusCode != http.StatusOK && resp.StatusCode != http.StatusAccepted {
        body, _ := ioutil.ReadAll(resp.Body) // Ignore any further error as this is for an error message only.
        return fmt.Errorf("unexpected status code %d while pushing to %s: %s", resp.StatusCode, p.fullURL(), body)
    }
    return nil
}
.
Comments powered by Disqus.