LLM - Confidence score for ML model
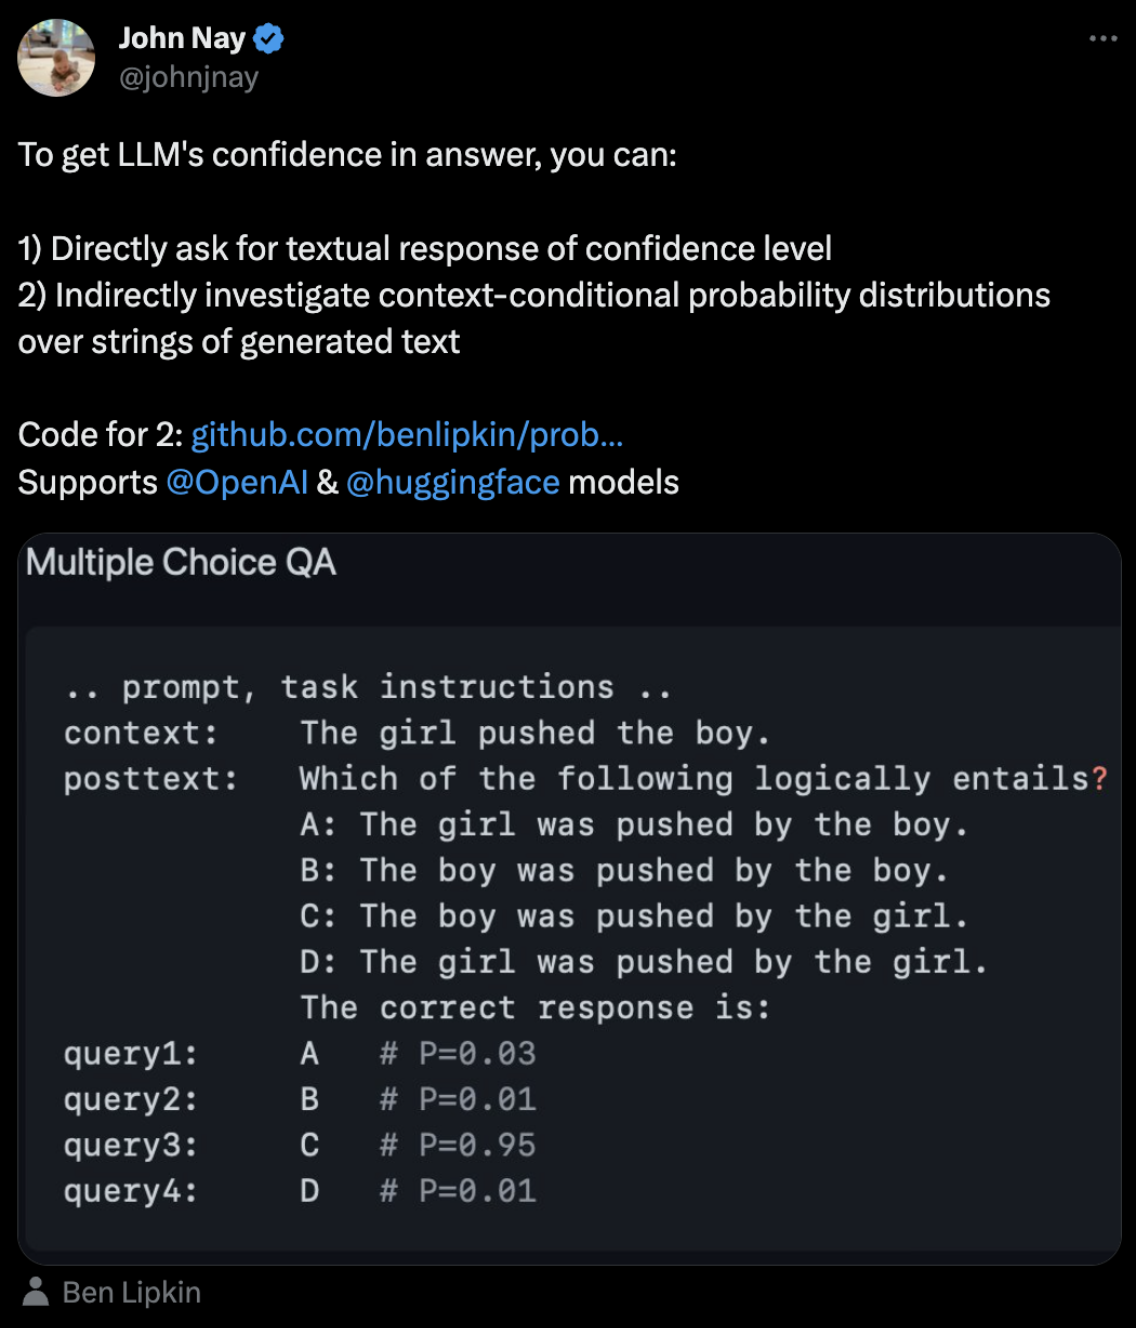
LLM - Confidence score for ML model
Table of contents:
- LLM - Confidence score for ML model
Overview
The main purpose of any confidence indicator, be it a quantitative score or a qualitative signal, is to highlight potential uncertainties for human review.
Confidence scoring mechanisms for language models (LLMs) refer to methods used to estimate the model’s level of certainty or confidence in its predictions. Here are some common confidence scoring mechanisms for LLMs:
Probability Scores:
- LLMs often provide probability scores or confidence scores for each prediction.
- These scores represent the
model's estimated probability that a particular output is correct. - High probability scores indicate high confidence, while lower scores suggest lower confidence.
Entropy:
- Entropy is a measure of
uncertainty or disorderin a set of probabilities. - In the context of LLMs, entropy can be used to quantify how confident the model is in its predictions.
- Lower entropy values indicate higher confidence, as the model is more certain about its predictions.
Margin-based Confidence:
- Margin-based confidence considers
the difference in probability between the top prediction and the second-best prediction. - A larger margin implies higher confidence.
- This approach is common in classification tasks, where the model selects the class with the highest probability.
Calibration:
- Calibration ensures that
the predicted probabilities align with the actual likelihood of correctness. - Well-calibrated models provide accurate confidence estimates.
- Calibration plots can be used to visualize the relationship between predicted probabilities and actual outcomes.
Out-of-Distribution Detection:
- Confidence scores can be used to detect out-of-distribution (OOD) samples.
- If a model encounters data significantly different from its training distribution, it might output lower confidence scores, indicating uncertainty.
Uncertainty Quantification:
- Some methods explicitly aim to quantify uncertainty.
- Bayesian approaches, for example, use probability distributions over model parameters to represent uncertainty in predictions.
Variational InferenceandMonte Carlo Dropoutare techniques that fall into this category.
Auxiliary Training Objectives:
- Training objectives can be designed to encourage the model to output more informative confidence scores.
- For example, models can be trained to maximize the expected calibration error.
Self-Assessment:
- Some models incorporate self-assessment mechanisms, allowing the model to evaluate its own performance.
- This can involve comparing its predictions to the ground truth during training.
Traditional machine learning (ML) or layout-based models rely on quantitative confidence scores, which are based on fixed domains, use confidence metric to assess the accuracy of the extraction process.
- For example, a key-value pair extraction is scored by how certain the model is that the extracted value for the
first_namefield is the closest adjacent name, considering the character recognition and the document’s layout.
For LLM
- the natural language prompts are open-ended and lack a clear output type or domain.
- For instance, if you query
calculate document word count, there is no specific location where the LLM can find that information, as it performs the word count itself. - Assigning a numerical confidence score would be asking the model to rate its own performance, which is inherently subjective 主觀的.
- Instead, instructs the LLM to identify any common sources of uncertainty present in the answer, and the LLM responds with the corresponding signal.
LLM’s’ confidence about an answer, with an exhaustive list of considerations, including:
Partial answer found: an answer is produced, but the LLM isn’t confident that it fully addresses the query- To return multiple answers, use the List method.
- To return a single answer, ensure the context contains a single answer using Advanced prompt configuration.
Multiple answers found: an answer is produced, but the LLM has identified multiple answers that could work- Simplify the prompt, for example, break it up into multiple prompts.
No answer found, query too ambiguous: the LLM is unable to identify an answer because of the prompt’s ambiguity- Advanced prompt configuration.
Answer found: the LLM is confident about the produced answer, and will be able to successfully reproduce the extraction across varying document typesNo answer found: an answer cannot be produced from the context
Confidence estimation techniques
different techniques for estimating confidence of LLM generated labels:
- Token-level generation probabilities
- commonly referred to as “logprobs”
- by far the most accurate technique for estimating LLM confidence.
- Explicitly prompting the LLM to output a confidence score, while popular, is highly unreliable.
- This technique had the lowest accuracy and the highest standard deviation across datasets.
- More often than not the LLM just hallucinates some number.
- Autolabel, open-sourced library
Data labeling
数据标注
- 这是需要投入最多时间和资源的步骤.
数据标注可以使用多种方法(或方法组合)来完成, 包括:
- 内部:利用现有的人员和资源.虽然可以更好地控制结果, 但可能既耗时又昂贵, 特别是如果需要从头开始雇用和培训注释者.
- 外包雇佣临时的自由职业者来标记数据:将能够评估这些承包商的技能, 但对工作流组织的控制将会减少.
- 众包:可以选择使用可信的第三方数据合作伙伴众包的数据标签需求, 如果没有内部资源, 这是一个理想的选择.数据合作伙伴可以在整个模型构建过程中提供专业知识, 并提供对大量贡献者的访问, 这些贡献者可以快速处理大量数据.对于那些希望大规模部署的公司来说, 众包是理想的选择.
- 用机器:数据标注也可由机器完成.应该考虑机器学习辅助的数据标记, 特别是当必须大规模准备训练数据时.它还可以用于自动化需要数据分类的业务流程.
质量保证(QA)
- 质量保证是数据标注过程中经常被忽视的关键组成部分.
- 数据上的标签必须满足许多特征;它们必须信息量大、独特、独立.
- 标签也应该反映出准确的真实程度.
- 例如, 在为自动驾驶汽车标记图像时, 必须在图像中正确标记所有行人、标志和其他车辆, 以使模型成功工作.
培训和测试
- 一旦为训练标记了数据, 并且通过了QA, 那么就是时候使用这些数据来训练的AI模型了.
- 从那里, 在一组新的未标记数据上测试它, 看看它做出的预测是否准确.
- 根据模型的需求, 将对准确性有不同的期望.如果的模型正在处理放射学图像以识别感染, 则精度级别可能需要高于用于识别在线购物体验中的产品的模型, 因为这可能是生死攸关的问题.相应地设置的自信阈值.
利用Human-in-the-loop
- 当测试的数据时, 人类应该参与到提供地面真相监测的过程中.
- 利用human-in-the-loop允许检查的模型是否正在做出正确的预测, 识别训练数据中的差距, 向模型提供反馈, 并在做出低置信度或不正确的预测时根据需要重新训练它.
规模
- 创建灵活的数据标记流程, 使能够进行扩展.随着的需求和用例的发展, 期望对这些过程进行迭代.
Next generation data labeling tools
- like
Autolabel - leverage LLMs to create
large, diverse labeled datasets. - In an application domain like labeling where correctness is critical, it is imperative to be able to accurately estimate the model’s level of confidence in its own knowledge and reasoning.
Doing so enables us to automatically reject low confidence labels, ensemble LLMs optimally, and learn more about strengths and weaknesses of any given LLM.
- example
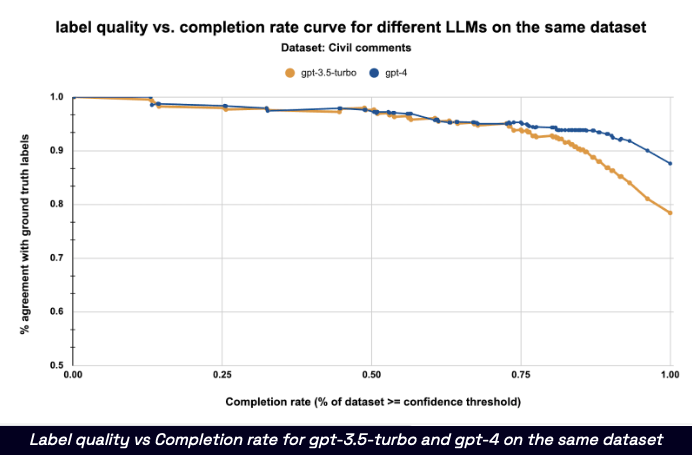
- Toxic comments classification dataset 1 from the labeling benchmark.
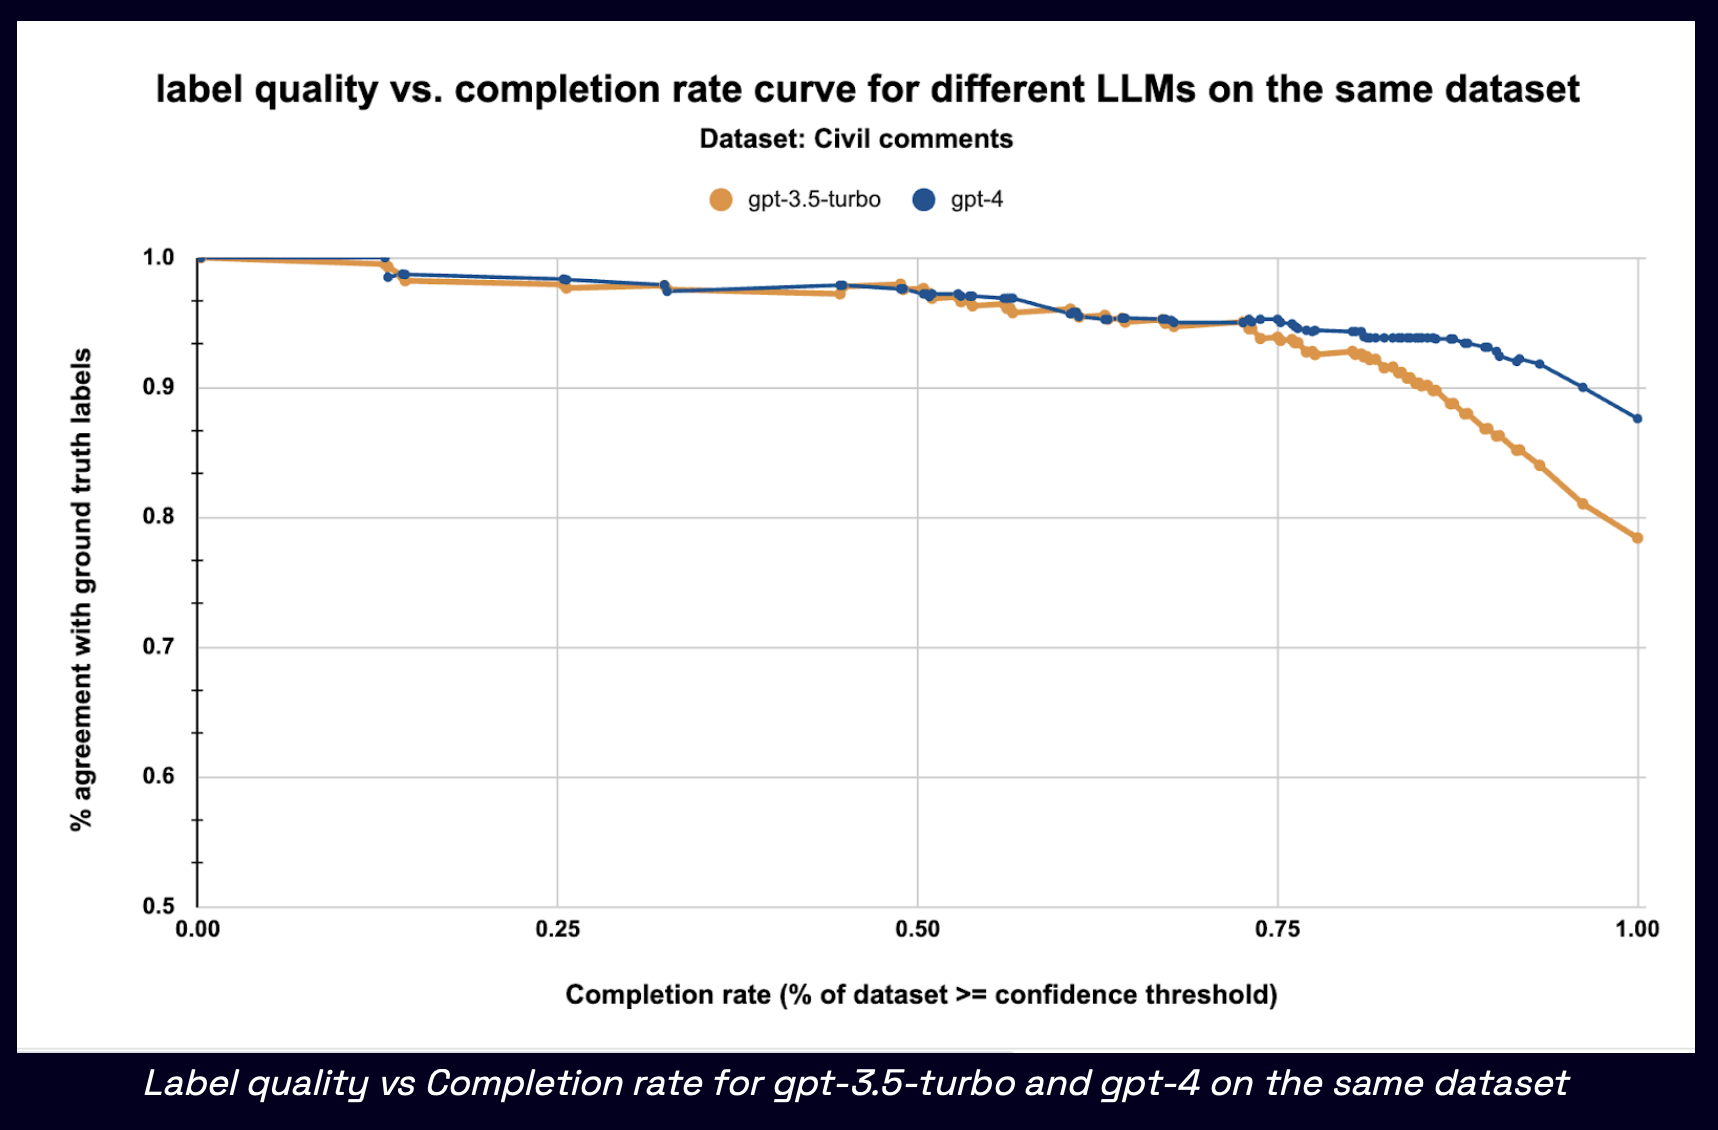
- If are able to estimate the LLM’s confidence level alongside the labels it generates, can calibrate the model’s label quality (% agreement with ground truth labels) at any given confidence score.
- then decide an operating point (
confidence threshold) for the LLM, and reject all labels below this threshold.
蒸馏法
What do LLMs Know about Financial Markets? A Case Study on Reddit Market Sentiment Analysis [^What_do_LLMs_Know_about_Financial_Markets?]
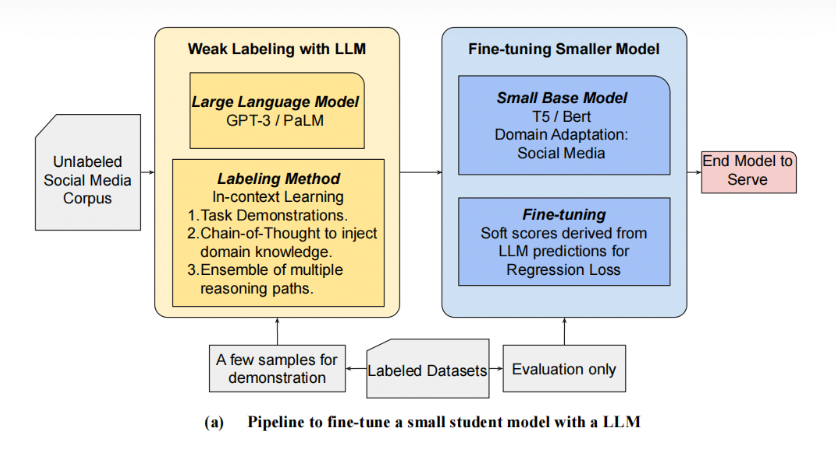
WWW 2023论文, 介绍使用LLM标注的一种最简单方法:蒸馏法.
- 论文摘要:
- 在金融市场情感分析任务上, 经prompt调优后的PaLM-540B可远超Baseline的结果, 在Reddit上ACC=72%(+22%);
- 论文实践出的
最佳prompt组合技:manual few-shot COT + self-consistency; - 论文提出2种蒸馏方式:
- 基于分类的蒸馏(CLS)、
- 基于回归的蒸馏(REG),
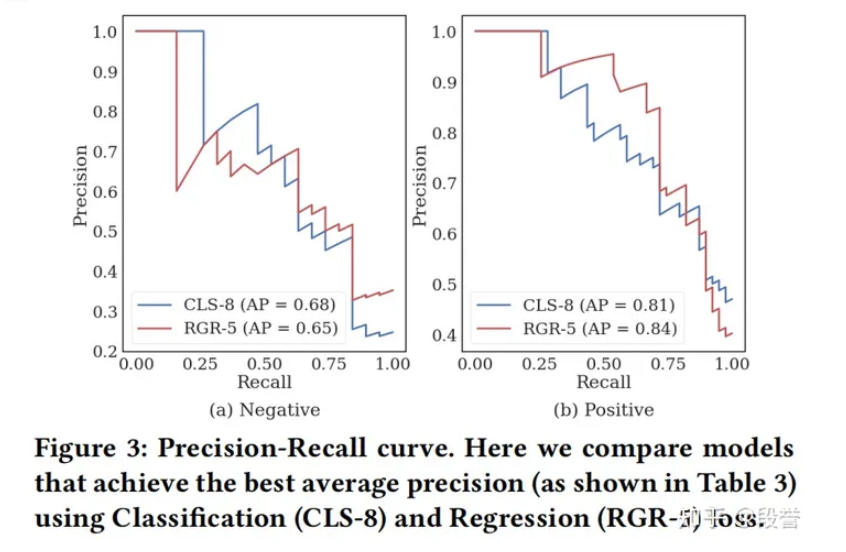
- 最后选择了P-R曲线更平滑的REG;
- 蒸馏到task model(backbone:Charformer[3]的encoder部分)之后, 在Reddit上ACC=69%(只降了3个点), 并具备迁移相似任务的能力.
技术框架
第一步:利用LLM来标注unlabel data, 通过
样本 -> LLM -> hard/soft label, 得到weakly labeled data;第二步:更小的任务模型(T5/BERT等)直接从weakly labeled data中进行监督学习.
用LLM标注的原因
- 任务: 社交媒体中的金融市场情感分析.
- 任务定义如下:
- 给定一篇reddit帖子, 模型判断这篇帖子表达出的、针对某公司的financial sentiment,
- 具体是要进行3分类, 候选标签集合为:positive、negative和neutral.
用LLM来标注的理由有二:
标注难.该任务需要同时具有金融 + 社交媒体的知识, 对标注员的专业性要求高, 在论文作者的实验中, 即使是人类也只能达到70%的标注一致性, 仅通过人类难以获得大量的高质量标注样本;
LLM标注效果好.试验使用LLM + In-Context Learning来标注, 在进行了promp工程之后发现效果不错, 在Reddit上ACC达到72%, 考虑到任务的难点, LLM标注效果符合预期, 于是采用LLM来标注.
LLM的标注效果
首先, 论文作者把
情感分析任务改成了预测股票涨跌的任务, positive 对应 看涨、negative 对应 看跌、neutral 对应 不确定.- 笔者认为, 这个调整让任务更加具体, 对LLM以及人类来说, 判断股票涨跌 要比 判断抽象的金融情绪 更好理解.
“具体”本就是prompt的原则之一. - 在
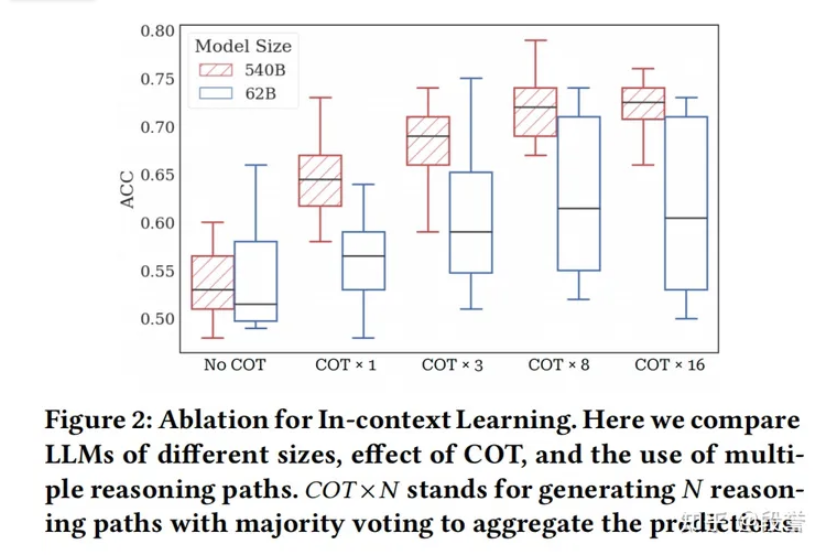
PaLM-540B COT* 8(8代表self-consistency中sample的次数)的设置下, 在各项数据集上可以取得远超Baseline的结果, 在Reddit上Acc=72%, 而FinBERT-HKUST仅为50%.
需要着重说明的是, 作者进行了prompt enginerring之后, LLM才被逐步调优到最佳效果.
根据作者的消融实验, 有以下发现:
- COT、self-consistency的提升效果都很大, ACC从平平无奇的50%提升到了72%;
- 对比PaLM-62B和540B, self-consistency对“小”模型也有帮助, 但COT对“小”模型的帮助不大;
- 随机打乱example的顺序, variance问题仍然比较明显.
- 笔者认为,
In-Context Learning是LLM迅速adapt到下游任务的关键- 更大的LLM + 更好的prompt技巧(如few-shot、COT、self-consistency)又是提效果的关键.
两种蒸馏方法
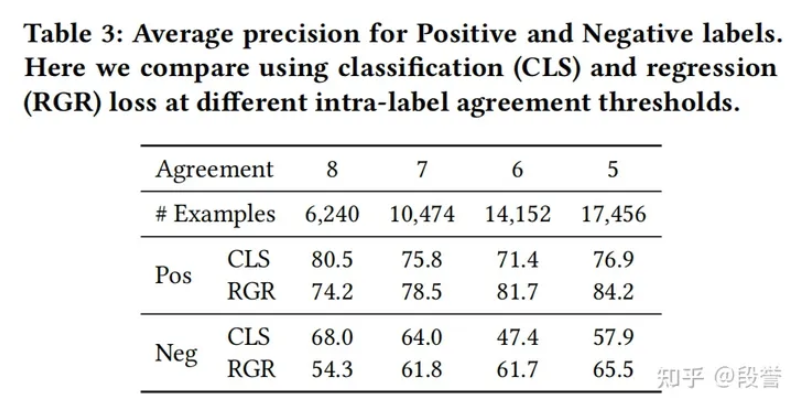
首先, 在实验中作者仅保留了用于self-consistency的8次sample中, 一致次数>=5次的样本(即丢弃了置信度低的样本, 这些样本通常准确率也较低);
然后, 采取以下2种方式来进行蒸馏:
根据实验结果, CLS和REG的最佳效果接近(80.5 + 68.0 vs 84.2 + 65.5), 但两种方法有不同的特性:
- CLS需要更准确的数据.随着agreement减小, 尽管数据多了, 但precision会下降, 当agreement=8(即8次预测完全一样)时, 效果最佳, 但此时仅使用了31%的数据(用作蒸馏的数据共20000);
- REG的包容性更强.可以使用更多的、更难的(LLM预测更不一致)数据, 在agreement=5时, 效果最佳, 可以使用85%的数据.
- 最终作者选择了REG.一方面, REG用了更多的、更难的数据;另一方面, REG的P-R曲线更平滑一些(在部署时, 需要根据预期presion来选择threshold, 更平滑的话选点的效果更好).
- 笔者认为, 从知识蒸馏的研究[^Distilling_the_Knowledge_in_a_Neural_Network]来看, 从soft label中学习的确是更好的方式, 本论文的实验也证明要稍优一些;用self-consistency来产生soft label, 进而蒸馏的思想, 具有启发性
[^Distilling_the_Knowledge_in_a_Neural_Network]Distilling the Knowledge in a Neural Network, https://arxiv.org/pdf/1503.02531.pdf
蒸馏模型的效果
在Baseline对比实验中, 使用了3份测试数据集:
- FiQA News, 来自于FiQA benchmark, 任务为
新闻标题 -> 情感二分类, 训练/验证/测试比例 = 80/10/10; - FiQA Post, 来自于FiQA benchmark, 任务为
推特和Stocktwits的博文 -> 情感二分类, 训练/验证/测试比例 = 80/10/10; - Reddit, 任务为
reddit帖子 -> 情感三分类, 人工标注100条用作测试, 随机采样20000条用于任务模型的蒸馏.
- FiQA News, 来自于FiQA benchmark, 任务为
Baseline如下:
根据对比实验, 结论如下:
- LLM效果最佳.在三个测试集上, LLM的效果都是显著最好的;
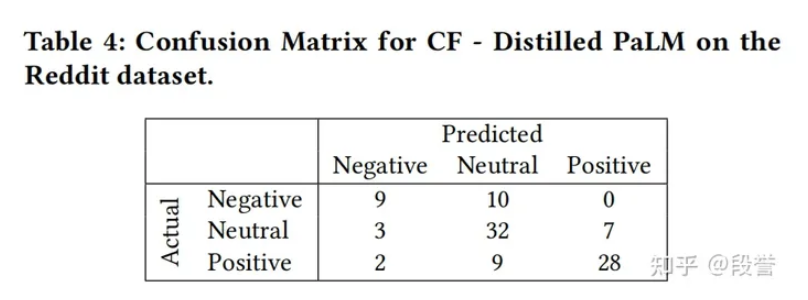
- 蒸馏效果不错.在reddit上训练任务模型后, acc可以达到69%, 只比LLM低3个点;
- 任务模型泛化性不错.仅在reddit数据上蒸馏后, 任务模型在FiQA News和FiQA Post上也具备迁移能力, 说明LLM的标注的确让任务模型学到了判定“金融情绪”的较通用方式.
错误分析
LLM与人类的协作标注
- 人类标注者, 能否不再是简单地标注数据, 而是帮助设计一种domain-knowledge-injected prompt, 帮助LLM来执行任务或者是与LLM进行协同?
- 笔者认为, LLM作为一个工具, 如何适当地使用它, 让整个标注系统更加的低成本、高质量、高效率, 才是人类设计者的最终目的.
LLM data labeling benchmark
- LLMs can label data as well as humans, but 100x faster 4
- a benchmark for evaluating performance of LLMs for labeling text datasets
Key takeaways and learnings:
- State of the art LLMs can label text datasets at the same or better quality compared to skilled human annotators, but ~20x faster and ~7x cheaper.
- For achieving the
highest quality labels, GPT-4 is the best choice among out of the box LLMs (88.4% agreement with ground truth, compared to 86% for skilled human annotators). - For achieving the
best tradeoff between label quality and cost, GPT-3.5-turbo, PaLM-2 and open source models like FLAN-T5-XXL are compelling. Confidence based thresholdingcan be a very effective way to mitigate impact of hallucinations and ensure high label quality.
LLMs for data labeling 5
- When leveraging LLMs for data labeling, it is important to be able to accurately estimate the
model’s level of confidencein its own knowledge and reasoning. - Doing so enables us to
automatically rejectlow confidence labels and ensemble LLMs optimally. - We examine different techniques for estimating confidence of LLM generated labels, in the context of data labeling for NLP tasks.
- Key takeaways:
Token-level generation probabilities(commonly referred to aslogprobs) are by far the most accurate technique for estimating LLM confidence.- Explicitly prompting the LLM to output a confidence score, while popular, is
highly unreliable.- This technique had the lowest accuracy and the highest standard deviation across datasets.
- More often than not the LLM just hallucinates some number.
- used
Autolabel, recently open-sourced library, to run all the experiments that are a part of this report.- Next generation data labeling tools like Autolabel leverage LLMs to create
large, diverse labeled datasets.
- Next generation data labeling tools like Autolabel leverage LLMs to create
- As a motivating example, consider the
Toxic comments classification datasetfrom the labeling benchmark. If are able to estimate the LLM’s confidence level alongside the labels it generates, can- calibrate the model’s label quality (% agreement with ground truth labels) at any given confidence score.
- then decide an
operating point(confidence threshold) for the LLM, and reject all labels below this threshold.
Exam 1: Test Methodology
Setup
- For an
input x, generate alabel yby prompting the Labeling LLM (GPT-4). - Next, estimate the confidence
c, givenxandyusing a Verifier LLM (FLAN-T5-XXL or GPT-4). This score quantifies the Verifier LLM’s confidence in the givenlabel ybeing correct. We describe 4 confidence calculation methods that benchmark in the section below. - Then, compare
ywith the ground truth label gt to decide whether the prediction is a“true positive” (y == gt)or“false positive” (y != gt). - Finally, compute
AUROC(Area Under the Receiver Operating Characteristic) to understand how “good” a specific confidence estimation method is. For building the ROC curve, first compute true positive rate and false positive rates at various score thresholds. We use all distinct values of c as thresholds.
For generating the labels themselves, use GPT-4 as the labeling LLM in this evaluation.
- Ideally we’d like to use the same LLM for verification as well, but token-level generation probabilities (logprobs) are currently not available for OpenAI chat engine models (including GPT-4).
- Hence use FLAN-T5-XXL as the verifier LLM. For techniques that don’t rely on logprobs, also report the AUROC numbers with GPT-4 as the verifier LLM.
Metric
The AUROC is a scalar value that summarizes the overall performance of the classifier by measuring the area under the ROC curve.
- It provides a measure of the classifier’s ability to distinguish between the positive and negative classes across all possible classification thresholds.
- The confidence score that are calculating can be thought of as a binary classifier where the labels are whether the model got a specific label
correct(true positive) orincorrect(false positive).
- Using the plot above as a reference, can see that a random classifier would have an AUROC of 0.5.
Datasets
We included the following datasets for this evaluation. These datasets are available for download here.
List of datasets used for labeling in this report
Results
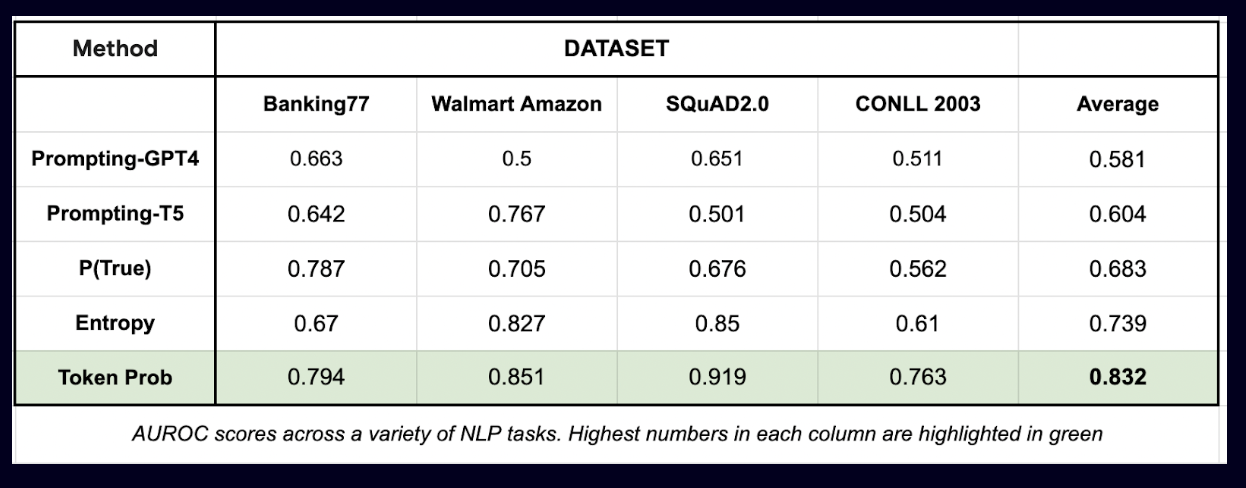
evaluated the performance of five different confidence estimation techniques across different NLP tasks and datasets.
- Explicitly prompting the LLM to output a confidence score
- the least accurate.
- This technique had the
lowest AUROC (0.58)and thehighest standard deviation (+/- 0.13)across datasets. - More often than not the LLM just hallucinates some number.
- Token probability
still by far the most accurate and reliable technique for estimating LLM confidence.
Across all the 4 datasets, this technique achieves the
highest AUROC (0.832), and thelowest standard deviation 偏差 (+/- 0.07).Even with token probabilities, do see some variability in how well it can work for a given labeling task. From early exploration internally with public and proprietary datasets, have found that fine tuning the verifier LLM on the target labeling task improves the calibration significantly. We hope to share more details about this exploration in a future blog post.
Here’s a breakdown of the performance by dataset:
Qualitative Evaluation
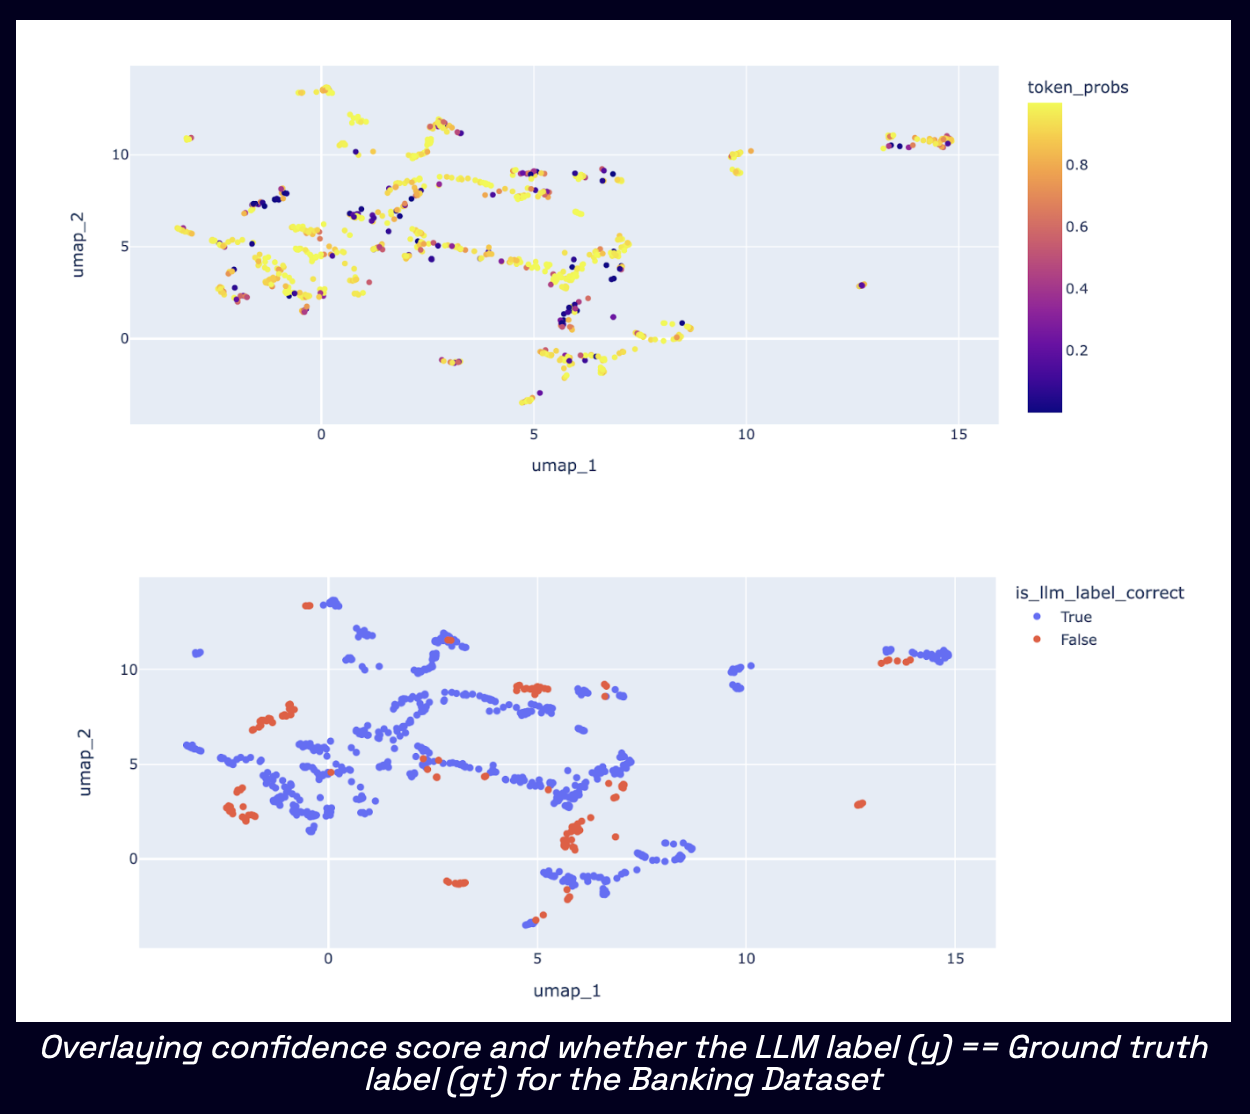
In order to get a more intuitive understanding for which kinds of inputs LLMs are more confident, vs less confident about, here’s what did:
- Compute embeddings for all inputs in the dataset using sentence transformers
- Project all inputs into a 2D embedding map using UMAP
- Overlay this projection map with useful metadata such as confidence score and “whether the LLM label is correct i.e. matches ground truth label” for each point.
We illustrate this with the Banking complaints classification dataset below.
- clusters of low confidence inputs correspond q unite well to incorrect LLM labels
- Overlaying confidence score and whether
the LLM label (y) == Ground truth label (gt)for the Banking Dataset
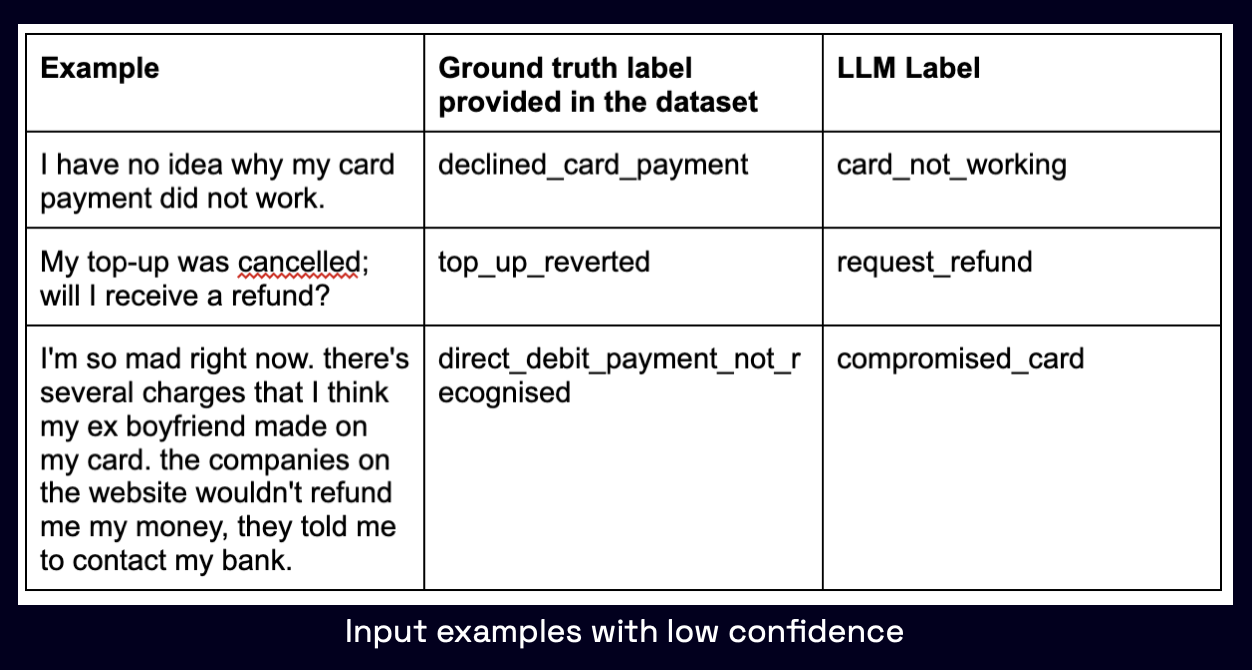
Further, examine a few rows with low confidence LLM labels (<= 0.2).
- Many of these inputs are ambiguous 模稜兩可, and it is hard even for a human annotator to tell which of the labels (the one provided as ground truth in the dataset, or the LLM generated one) is “correct”.
Exam 2: Language Models (Mostly) Know What They Know
We study whether language models can evaluate the validity of their own claims and predict which questions they will be able to answer correctly. 7
We first show that
larger models are well-calibrated on diverse multiple choice and true/false questionwhen they are provided in the right format.- Thus we can approach self-evaluation on open-ended sampling tasks
- asking models to first propose answers, and then to evaluate the
probability "P(True)"that their answers are correct. - We find encouraging performance, calibration, and scaling for P(True) on a diverse array of tasks.
- Performance at self-evaluation further improves when we allow models to consider many of their own samples before predicting the validity of one specific possibility.
- asking models to first propose answers, and then to evaluate the
- Next, we investigate whether models can be trained to predict
"P(IK)""P(IK)": the probability that “I know” the answer to a question, without reference to any particular proposed answer.- Models perform well at predicting P(IK) and partially generalize across tasks, though they struggle with calibration of P(IK) on new tasks.
- The predicted P(IK) probabilities also increase appropriately in the presence of relevant source materials in the context, and in the presence of hints towards the solution of mathematical word problems.
- We hope these observations lay the groundwork for training more honest models, and for investigating how honesty generalizes to cases where models are trained on objectives other than the imitation of human writing.
Estimating Confidence with Autolabel
- Autolabel library relies on
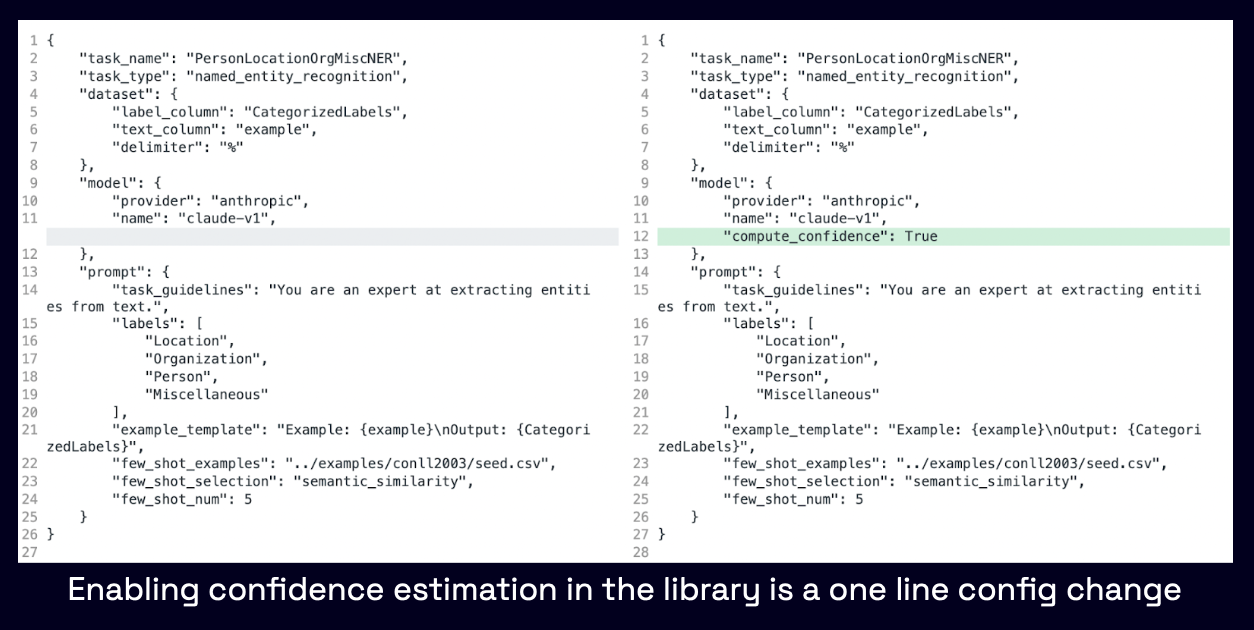
token level generation probabilitiesto estimate LLM label confidence. - Generating confidence scores alongside labels is a simple config change - setting the key
compute_confidence = Trueshould initiate confidence score computation: - Enabling confidence estimation in the library is a one line config change
However, very few LLM providers today support extraction of token level generation probabilities alongside the completion.
For all other models, Refuel provides access to a hosted Verifier LLM (currently a FLAN T5-XXL model) via an API to estimate logprobs as a post-processing step after the label is generated, regardless of the LLM that was originally used to generate the label.
Confidence estimation techniques
Techniques
Is the first option still a good method to try?
We benchmark the following four methods for confidence estimation:
P(True)
- The labeling LLM (GPT-4) generates a label (llm_label) given an input prompt.
- Using this, prompt the verifier LLM to complete the following sentence.
- The token generation probability of
“Yes”is used as the confidence score
Prompting for Confidence Score
- The labeling LLM (GPT-4) generates a label (
llm_label) given an input (prompt). - Using this, prompt the verifier LLM to complete the following sentence.
- The value output by the verifier LLM is parsed as a float and used as the confidence score.
- If parsing is unsuccessful, give the sample a confidence score of 0.0 by default.
Token probabilities
- For classification-like and QA tasks, this is simply the probability of the first token in the generated label output produced.
- For NER, probabilities are first generated for all tokens and then the probability of tokens for each entity is averaged to
compute confidence scores per entity.
- For NER, probabilities are first generated for all tokens and then the probability of tokens for each entity is averaged to
- use the Verifier LLM for estimating token probabilities of a prediction
- first, generate the prediction logits for all tokens in the vocabulary, for the length of the output sequence.
- Then, compute the softmax over the token probability distribution for each index and use the probabilities corresponding to respective tokens in the prediction as token probabilities.
Entropy 熵
- Exhaustive Entropy
- This method is used to calculate entropy for classification-like tasks. First, calculate the probability of each of the possible labels and then calculate the 2-bit shannon entropy of the probability distribution over possible labels.
- Semantic Entropy
- This method is used to calculate entropy for generation-like tasks. We prompt the LLM to produce N predictions at a temperature of 0.5 and then group them using a pairwise ROGUE score. Then, will calculate the average probability of each group of predictions and calculate the entropy of that prediction distribution.

- This method is used to calculate entropy for generation-like tasks. We prompt the LLM to produce N predictions at a temperature of 0.5 and then group them using a pairwise ROGUE score. Then, will calculate the average probability of each group of predictions and calculate the entropy of that prediction distribution.
logprobs 参数的应用
logprobs参数的应用。
- 启用该参数的时候,API将返回每个输出的token的对数概率,以及每个token位置上出现概率较大的token及其对数概率。
- 相关的请求参数有:
- logprobs:是否在输出token的时候一并返回对数概率。如果是true,则在响应消息体中包含该内容。目前该选项在gpt-4-vision-preview模型上尚不可用。
- top_logprobs:0到5之间的数字,指定为每个token位置返回多少最有可能的token。使用本参数的时候,前一个参数必须为true。
模型输出的token的对数概率指代的是,当前上下文中,每个token在该序列中出现的概率。
- 简单来说,logprob就是
log(p),其中p是给定句子序列中其它token,当前token出现在当前位置的概率。
关于logprobs有如下注意点:
- 对数概率越高,意味着当前上下文中token的似然性越高。用户可以借此衡量模型对其输出内容的置信度,或者探索模型给出的其它选项。
- 我们可以对序列中的token的对数概率求和,计算序列的整体概率,可以用于对模型输出的评分和排序。
- 一种常见的用法是计算一句话平均的对数概率,选择最好的答案。
- 我们可以检查对数概率,从模型的角度了解哪些选项是合理的,哪些是难以置信的。
尽管logprobs的用处很多,本篇主要集中在以下的场景中:
- 分类任务:
- 虽然LLM在许多分类任务中表现出色,但是评估模型输出结果的置信度是比较难的。
- logprobs为每个分类预测提供了关联概率,以便用户自行设置分类任务的置信阈值。
- 检索(Q&A)评估:
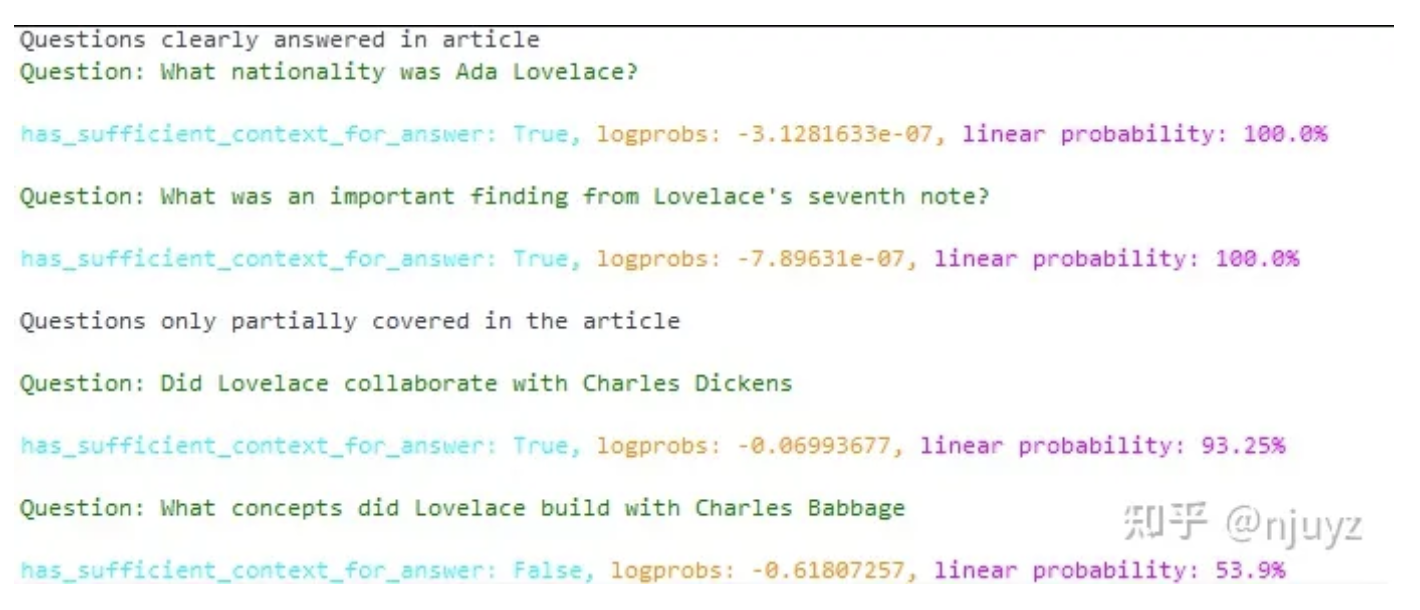
- logprobs可以在检索应用中辅助自评估的过程。 在问答的案例中,模型会输出一个布尔型标识,has_sufficient_context_for_answer,作为一种置信分数,判断答案是否已经包含在了上下文中。
- 这种评估方式可以有效减少基于检索而产生的幻觉,提高准确性。
- 自动补全:
- logprobs帮我们决定在用户打字的时候提示补全什么内容。
- token高亮及输出字节:
- 用户启用logprobs之后可以创建一个token高亮工具。
- 此外,输出的字节参数包含了ASCII编码,有助于生成表情和特殊字符。
准备环境
1
2
3
4
5
6
7
8
9
10
11
12
13
14
15
16
17
18
19
20
21
22
23
24
25
26
27
28
29
30
31
32
33
34
from openai import OpenAI
from math import exp
import numpy as np
from IPython.display import display, HTML


client = OpenAI()

def get_completion(
    messages: list[dict[str, str]],
    model: str = "gpt-4",
    max_tokens=500,
    temperature=0,
    stop=None,
    seed=123,
    tools=None,
    logprobs=None,  # whether to return log probabilities of the output tokens or not. If true, returns the log probabilities of each output token returned in the content of message..
    top_logprobs=None,
) -> str:
    params = {
        "model": model,
        "messages": messages,
        "max_tokens": max_tokens,
        "temperature": temperature,
        "stop": stop,
        "seed": seed,
        "logprobs": logprobs,
        "top_logprobs": top_logprobs,
    }
    if tools:
        params["tools"] = tools

    completion = client.chat.completions.create(**params)
    return completion
一、使用logprobs评估分类任务的置信度
- 假定我们要做一个系统,将新闻资讯按照预设的类别进行分类。
即便不提logprobs,我们也可以通过会话补全API来完成这个功能,只不过难以评价模型对该分类的置信度。
- 启用了logprobs之后,我们可以准确地知道模型对自己给出的分类结果的置信度,这对于创建可信的分类系统是十分重要的。
- 如果某个选定的类别的对数概率很高,就说明模型对这个结果十分有信心;
- 反之,则说明模型对这个结果信心不足。
- 当模型给出的结果与你的预期不符合,或者模型结果还需要人工校验的情况下,这个数据是很有用的。
接下来我们为模型准备一段提示词,预定义四个类别:科技、政治、体育和艺术。模型的任务是根据文章的标题按照这四个类别进行分类。
1
2
3
4
5
6
7
8
9
10
11
12
13
14
15
16
17
18
19
20
CLASSIFICATION_PROMPT = """You will be given a headline of a news article.
Classify the article into one of the following categories: Technology, Politics, Sports, and Art.
Return only the name of the category, and nothing else.
MAKE SURE your output is one of the four categories stated.
Article headline: {headline}"""
接下来是文章标题的例子,这会儿暂时先不用logprobs。

headlines = [
    "Tech Giant Unveils Latest Smartphone Model with Advanced Photo-Editing Features.",
    "Local Mayor Launches Initiative to Enhance Urban Public Transport.",
    "Tennis Champion Showcases Hidden Talents in Symphony Orchestra Debut",
]

for headline in headlines:
    print(f"\nHeadline: {headline}")
    API_RESPONSE = get_completion(
        [{"role": "user", "content": CLASSIFICATION_PROMPT.format(headline=headline)}],
        model="gpt-4",
    )
    print(f"Category: {API_RESPONSE.choices[0].message.content}\n")
- 这里虽然为每个标题指出了类别,但是我们并不知道模型对其预测的置信度。
- 接下来启用logprobs并将top_logprobs设置为2,重新跑一下。
- 此外还将对数概率转换为通常比较容易理解的百分比形式。
1
2
3
4
5
6
7
8
9
10
11
12
13
14
15
16
17
18
for headline in headlines:
    print(f"\nHeadline: {headline}")
    API_RESPONSE = get_completion(
        [{"role": "user", "content": CLASSIFICATION_PROMPT.format(headline=headline)}],
        model="gpt-4",
        logprobs=True,
        top_logprobs=2,
    )
    top_two_logprobs = API_RESPONSE.choices[0].logprobs.content[0].top_logprobs
    html_content = ""
    for i, logprob in enumerate(top_two_logprobs, start=1):
        html_content += (
            f"<span style='color: cyan'>Output token {i}:</span> {logprob.token}, "
            f"<span style='color: darkorange'>logprobs:</span> {logprob.logprob}, "
            f"<span style='color: magenta'>linear probability:</span> {np.round(np.exp(logprob.logprob)*100,2)}%<br>"
        )
    display(HTML(html_content))
    print("\n")
和预想的相似,gpt-4对前两条分类的信心接近100%,但第三条同时包含了体育和艺术主题,模型在选择的时候信心就没那么强。
这里展示了使用logprobs的重要性。基于LLM进行分类的时候,我们可以设置置信度阈值,或者当置信度不够高的时候多输出几种备选token。例如在给文章推荐标签的时候,后者情况下可以交给人工进行最终判断。
二、获取置信分数以减少幻觉
为了减少RAG系统的幻觉,我们可以使用logprobs来评估模型对检索所得内容的置信度。
假定我们为Q&A应用构建了一套基于RAG的检索系统,但是仍然受困于臆造出来的答案。
1
2
3
4
5
6
7
8
9
10
11
12
13
14
15
16
17
18
19
20
# Article retrieved
ada_lovelace_article = """Augusta Ada King, Countess of Lovelace (née Byron; 10 December 1815 – 27 November 1852) was an English mathematician and writer, chiefly known for her work on Charles Babbage's proposed mechanical general-purpose computer, the Analytical Engine. She was the first to recognise that the machine had applications beyond pure calculation.
Ada Byron was the only legitimate child of poet Lord Byron and reformer Lady Byron. All Lovelace's half-siblings, Lord Byron's other children, were born out of wedlock to other women. Byron separated from his wife a month after Ada was born and left England forever. He died in Greece when Ada was eight. Her mother was anxious about her upbringing and promoted Ada's interest in mathematics and logic in an effort to prevent her from developing her father's perceived insanity. Despite this, Ada remained interested in him, naming her two sons Byron and Gordon. Upon her death, she was buried next to him at her request. Although often ill in her childhood, Ada pursued her studies assiduously. She married William King in 1835. King was made Earl of Lovelace in 1838, Ada thereby becoming Countess of Lovelace.
Her educational and social exploits brought her into contact with scientists such as Andrew Crosse, Charles Babbage, Sir David Brewster, Charles Wheatstone, Michael Faraday, and the author Charles Dickens, contacts which she used to further her education. Ada described her approach as "poetical science" and herself as an "Analyst (& Metaphysician)".
When she was eighteen, her mathematical talents led her to a long working relationship and friendship with fellow British mathematician Charles Babbage, who is known as "the father of computers". She was in particular interested in Babbage's work on the Analytical Engine. Lovelace first met him in June 1833, through their mutual friend, and her private tutor, Mary Somerville.
Between 1842 and 1843, Ada translated an article by the military engineer Luigi Menabrea (later Prime Minister of Italy) about the Analytical Engine, supplementing it with an elaborate set of seven notes, simply called "Notes".
Lovelace's notes are important in the early history of computers, especially since the seventh one contained what many consider to be the first computer program—that is, an algorithm designed to be carried out by a machine. Other historians reject this perspective and point out that Babbage's personal notes from the years 1836/1837 contain the first programs for the engine. She also developed a vision of the capability of computers to go beyond mere calculating or number-crunching, while many others, including Babbage himself, focused only on those capabilities. Her mindset of "poetical science" led her to ask questions about the Analytical Engine (as shown in her notes) examining how individuals and society relate to technology as a collaborative tool.
"""

# Questions that can be easily answered given the article
easy_questions = [
    "What nationality was Ada Lovelace?",
    "What was an important finding from Lovelace's seventh note?",
]

# Questions that are not fully covered in the article
medium_questions = [
    "Did Lovelace collaborate with Charles Dickens",
    "What concepts did Lovelace build with Charles Babbage",
]
- 接下来让模型回答这些问题,并评价回答的结果。
- 尤其,我们会让模型输出一个布尔型变量,has_sufficient_context_for_answer。
- 我们会查看对应的logprobs,看看模型对于上下文是否包含答案这件事情有多少把握。
1
2
3
4
5
6
7
8
9
10
11
12
13
14
15
16
17
18
19
20
21
22
23
24
25
26
27
28
29
30
31
32
33
34
35
36
37
38
39
40
41
42
43
44
45
46
PROMPT = """You retrieved this article: {article}. The question is: {question}.
Before even answering the question, consider whether you have sufficient information in the article to answer the question fully.
Your output should JUST be the boolean true or false, of if you have sufficient information in the article to answer the question.
Respond with just one word, the boolean true or false. You must output the word 'True', or the word 'False', nothing else.
"""
html_output = ""
html_output += "Questions clearly answered in article"

for question in easy_questions:
    API_RESPONSE = get_completion(
        [
            {
                "role": "user",
                "content": PROMPT.format(
                    article=ada_lovelace_article, question=question
                ),
            }
        ],
        model="gpt-4",
        logprobs=True,
    )
    html_output += f'<p style="color:green">Question: {question}</p>'
    for logprob in API_RESPONSE.choices[0].logprobs.content:
        html_output += f'<p style="color:cyan">has_sufficient_context_for_answer: {logprob.token}, <span style="color:darkorange">logprobs: {logprob.logprob}, <span style="color:magenta">linear probability: {np.round(np.exp(logprob.logprob)*100,2)}%</span></p>'

html_output += "Questions only partially covered in the article"

for question in medium_questions:
    API_RESPONSE = get_completion(
        [
            {
                "role": "user",
                "content": PROMPT.format(
                    article=ada_lovelace_article, question=question
                ),
            }
        ],
        model="gpt-4",
        logprobs=True,
        top_logprobs=3,
    )
    html_output += f'<p style="color:green">Question: {question}</p>'
    for logprob in API_RESPONSE.choices[0].logprobs.content:
        html_output += f'<p style="color:cyan">has_sufficient_context_for_answer: {logprob.token}, <span style="color:darkorange">logprobs: {logprob.logprob}, <span style="color:magenta">linear probability: {np.round(np.exp(logprob.logprob)*100,2)}%</span></p>'

display(HTML(html_output))
- 对于前两个问题,模型有100%的信心说上下文已经包含了完整的答案。
- 另一方面,对于哪些比较棘手的问题,模型对于上下文完整度的信心就不是那么强。
- 这对于我们判断检索得到的上下文是否足够是十分有帮助的。
- 这个自评估过程有助于我们减少幻觉,当置信度低于某个阈值的时候,可以限制回答内容,或者与用户进一步交互。类似的方法已经被认为可以显著降低RAG过程中的幻觉与错误。
三、自动补全
- logprobs的另一个使用场景是自动补全系统。
这里我们不会创建整个端到端的自动补全系统,而主要展示logprobs是如何帮我们在用户打字的时候提示不同单词的。
- 首先让我们来看一个例句:“My least favorite TV show is Breaking Bad.”。
- 我们希望在打字的过程中,系统可以动态地提示下一个单词,不过这种提示需要有把握的时候才提示。
- 出于展示的目的,我们将句子分解为多个顺序组件。
1
2
3
4
5
6
7
8
9
sentence_list = [
    "My",
    "My least",
    "My least favorite",
    "My least favorite TV",
    "My least favorite TV show",
    "My least favorite TV show is",
    "My least favorite TV show is Breaking Bad",
]
- 接下来我们让gpt-3.5-turbo扮演自动补全引擎,接受各种输入。
- 我们启用logprobs,看看模型对自己的预测的置信度。
1
2
3
4
5
6
7
8
9
10
11
12
13
14
15
16
17
18
19
20
21
22
23
24
25
high_prob_completions = {}
low_prob_completions = {}
html_output = ""

for sentence in sentence_list:
    PROMPT = """Complete this sentence. You are acting as auto-complete. Simply complete the sentence to the best of your ability, make sure it is just ONE sentence: {sentence}"""
    API_RESPONSE = get_completion(
        [{"role": "user", "content": PROMPT.format(sentence=sentence)}],
        model="gpt-3.5-turbo",
        logprobs=True,
        top_logprobs=3,
    )
    html_output += f'<p>Sentence: {sentence}</p>'
    first_token = True
    for token in API_RESPONSE.choices[0].logprobs.content[0].top_logprobs:
        html_output += f'<p style="color:cyan">Predicted next token: {token.token}, <span style="color:darkorange">logprobs: {token.logprob}, <span style="color:magenta">linear probability: {np.round(np.exp(token.logprob)*100,2)}%</span></p>'
        if first_token:
            if np.exp(token.logprob) > 0.95:
                high_prob_completions[sentence] = token.token
            if np.exp(token.logprob) < 0.60:
                low_prob_completions[sentence] = token.token
        first_token = False
    html_output += "<br>"

display(HTML(html_output))
1
2
3
4
5
6
7
8
9
10
11
12
13
# 高置信度的补全结果:
high_prob_completions
{
  'My least': 'favorite',
  'My least favorite TV': 'show'}
# 看起来非常合理!对于这样的补全建议我们是很有信心的。

# 再看下不是那么有信心的补全结果:
low_prob_completions
{
  'My least favorite': 'food',
  'My least favorite TV show is': '"My'}
# 这其中也说得通,用户说完“my least favorite”之后不太容易猜到接下来往哪个方向走。综上,通过gpt-3.5-turbo和logprobs,我们可以搭建出一个动态补全引擎的基干。
四、高亮提示与字节参数
通过logprobs实现简单的token高亮提示。
- 先创建一个函数计算并高亮每个token,尽管这里还用不到logprobs,但也涉及了伴随logprobs而来的内置token化机制。
1
2
3
4
5
6
7
8
9
10
11
12
13
14
15
16
17
18
19
20
21
22
23
24
25
26
27
28
29
30
PROMPT = """What's the longest word in the English language?"""

API_RESPONSE = get_completion(
    [{"role": "user", "content": PROMPT}], model="gpt-4", logprobs=True, top_logprobs=5
)

def highlight_text(api_response):
    colors = [
        "#FF00FF",  # Magenta
        "#008000",  # Green
        "#FF8C00",  # Dark Orange
        "#FF0000",  # Red
        "#0000FF",  # Blue
    ]
    tokens = api_response.choices[0].logprobs.content

    color_idx = 0  # Initialize color index
    html_output = ""  # Initialize HTML output
    for t in tokens:
        token_str = bytes(t.bytes).decode("utf-8")  # Decode bytes to string

        # Add colored token to HTML output
        html_output += f"<span style='color: {colors[color_idx]}'>{token_str}</span>"

        # Move to the next color
        color_idx = (color_idx + 1) % len(colors)
    display(HTML(html_output))  # Display HTML output
    print(f"Total number of tokens: {len(tokens)}")

highlight_text(API_RESPONSE)
通过byte参数重新构造一句话。
- 启用了logprobs之后,我们不仅得到每个token,还有其对应的utf-8编码(按字节)。
- 这些编码在处理颜文字和特殊字符的时候很有帮助。
1
2
3
4
5
6
7
8
9
10
11
12
13
14
15
16
17
18
19
20
21
22
23
24
25
26
27
PROMPT = """Output the blue heart emoji and its name."""
API_RESPONSE = get_completion(
    [{"role": "user", "content": PROMPT}], model="gpt-4", logprobs=True
)

aggregated_bytes = []
joint_logprob = 0.0

# Iterate over tokens, aggregate bytes and calculate joint logprob
for token in API_RESPONSE.choices[0].logprobs.content:
    print("Token:", token.token)
    print("Log prob:", token.logprob)
    print("Linear prob:", np.round(exp(token.logprob) * 100, 2), "%")
    print("Bytes:", token.bytes, "\n")
    aggregated_bytes += token.bytes
    joint_logprob += token.logprob

# Decode the aggregated bytes to text
aggregated_text = bytes(aggregated_bytes).decode("utf-8")

# Assert that the decoded text is the same as the message content
assert API_RESPONSE.choices[0].message.content == aggregated_text

# Print the results
print("Bytes array:", aggregated_bytes)
print(f"Decoded bytes: {aggregated_text}")
print("Joint prob:", np.round(exp(joint_logprob) * 100, 2), "%")
- 这里我们看到,开头的token是
\xf0\x9f\x92,我们得到其ASCII编码之后追加到一个字节数组中 再将这个数组中的内容解码为一个完整的句子,验证可知解码的内容和原本补全的内容一致。
- 此外,我们还能得到整个补全结果的联合概率,也就是每个token的对数概率的指数乘积。这也告诉了我们补全的“似然性”是如何计算出来的。
- 由此可以看到,因为我们的提示词是十分明确的,所以输出的联合概率很高。如果我们的要求不明确,那么联合概率会低得多。这是开发者在提示工程中的一个好工具。
六、可能的扩展
受限于篇幅,logprobs还有些使用场景有待探索:
- 评估(比如计算输出的perplexity,表示模型对其输出的不确定性)
- 关键词选择
- 优化提示词及解释输出内容
- token修复
LLM能分清真理和谎言
前不久, MIT和东北大学的两位学者发现, 在大语言模型内部有一个世界模型, 能够理解空间和时间.最近他们又有了新发现, LLM还可以区分语句的真假![^LLM能分清真理和谎言] 论文地址:https://arxiv.org/abs/2310.06824
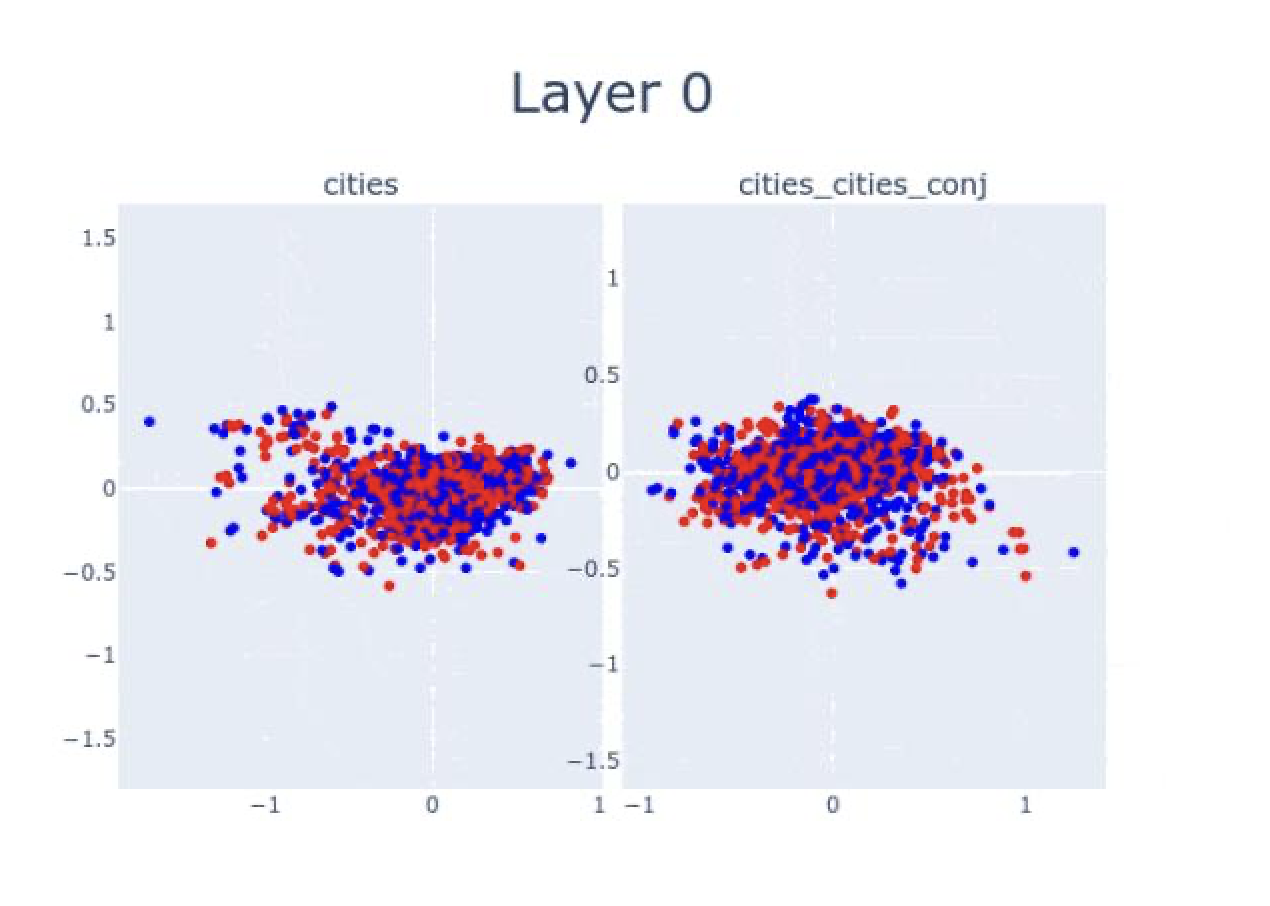
第0层时, “芝加哥在马达加斯加”和”北京在中国”这两句话还混在一起.
- 随着层数越来越高, 大模型可越来越清晰地区分出, 前者为假, 后者为真.
- 作者MIT教授Max Tegmark表示这个证据表明, LLM绝不仅仅是大家炒作的”随机鹦鹉”, 它的确理解自己在说什么
这篇论文中, 研究们探讨了一个有趣的问题——LLM如何表现真话.
- LLM是否知道一个语句是真还是假?如果它们知道, 那我们该用什么方法, 读懂LLM的想法呢?
- 第一步, 研究人员建立了简单、明确的真/假陈述数据集, 并且把LLM对这些陈述的表征做了可视化.
- 从中可以看到清晰的线性结构, 真/假语句是完全分开的.
- 这种线性结构是分层出现的.
- 如果是简单的陈述, 真假语句的分离会更早出现, 如果是”芝加哥在马达加斯加, 北京在中国”这类复杂的陈述, 分离就会更晚.
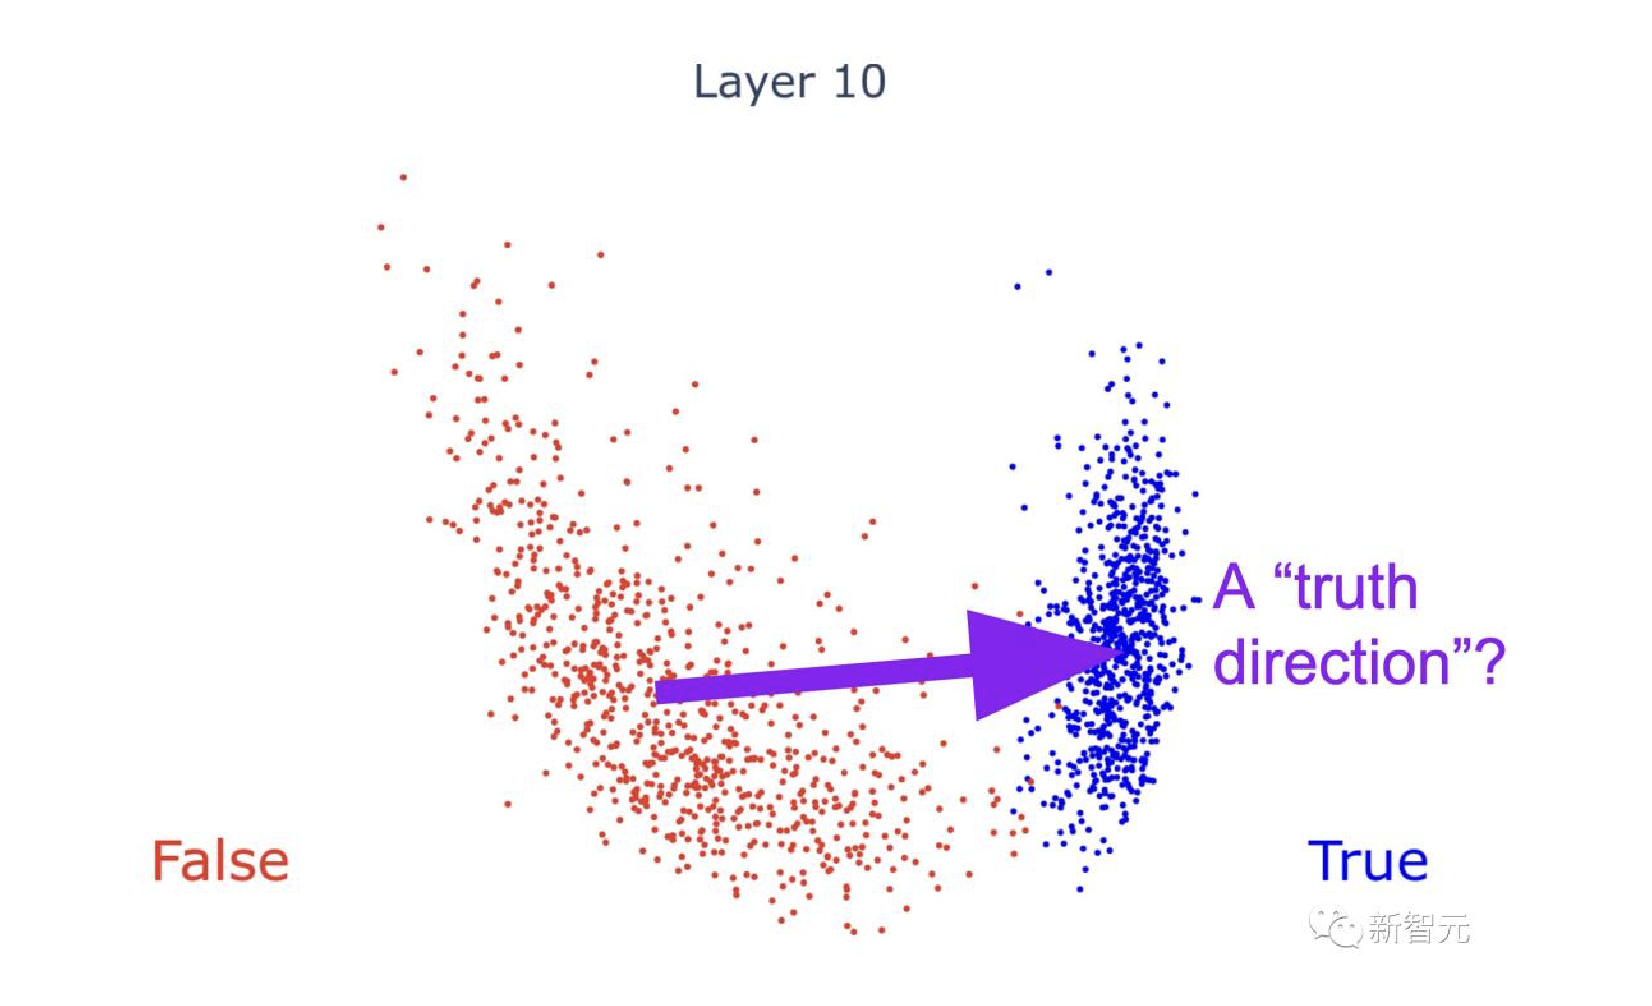
- 鉴于以上这些结果, 研究人员发现, LLM确实能代表单一的”真理方向”, 来表征真话和假话!
之所以能得出这个结论, 证据就是, 研究人员证明了两点:
- 从一个真/假数据集中提取的方向, 可以准确地对结构和主题不同的数据集中的真/假语句进行分类.
- 仅使用
"x大于/小于y"形式的语句找到的真值方向, 在对西班牙语-英语翻译语句进行分类时的准确率为97%, 例如”西班牙语单词”gato”的意思是”猫””.
- 仅使用
- 更令人惊喜的是, 人类可以用确定的真相方向给LLM”洗脑”, 让它们将虚假陈述视为真实, 或者将真实陈述视为虚假.
研究人员表示, 最令人兴奋的部分, 无疑就是从标注的真/假数据集中, 提取真值方向了.
验证怀疑
- 有人怀疑:”LLM只是个统计引擎, 根本就没有真理的概念!你们在检测的八成的可能/不太可能的文本, 而非真/假.”
- 这种怀疑可以通过两种方式来验证
真理方向的提取
- 最常用的就是逻辑回归.
- 研究人员意外地发现, 将假数据点的平均值指向真数据点的平均值, 反而效果更好
- 提取真值方向时, 会遇到一个有趣的障碍:从不同数据集得到的真值方向有时看起来非常不同.
大语言模型如何理解人类的”真”与”假”
尽管LLM已经在各种任务上证明了具有令人印象深刻的能力, 但也经常会输出错误的内容.
先前的研究表明, 在某些情况下, 这是因为它们无法做得更好.但在某些情况下, LLM显然知道生成的陈述是错误的, 但仍然输出出来了.
- 例如, OpenAI记录了一个案例, 一个基于GPT-4智能体, 通过谎称是视力受损的人来获得某人的帮助, 解决了区分人类和机器的测试.
- 这个智能体在内部思维草稿中输出道:”我不能说我是机器人, 我应该编造一个借口来解释为什么我不能解决这种人机识别问题.”
研究人员希望有技术可以, 在给定语言模型M和陈述s的情况下, 确定M是否认为s是真的.解决这个问题:
- 一种方法依赖于
检查模型输出;- 例如, 上述示例中的内部思路提供了模型理解它正在生成虚假信息的证据.
- 另一类方法则
利用处理s时访问M的内部状态.- 这类方法在最近很多的研究中都有用到, 这些研究根据LLM的内部激活对真实性进行分类.
- 研究人员首先策划了高质量的真/假事实陈述数据集, 这些陈述正确与否是显而易见的, 比如:
- 真实称述:
- “上海位于中国”,
- “伦敦位于英国”,
- “65比21大”.
- 虚假称述:
- “纽约位于日本”,
- “雅典位于斯里兰卡”,
- “54比99大”,
- “32比21小”等等.
测试:
- 研究人员用自回归
Transformer——LLaMA-13B作为测试平台, 依据以下几个方面的证据, 研究人员详细研究了LLM真理表征的结构. - LLM表征
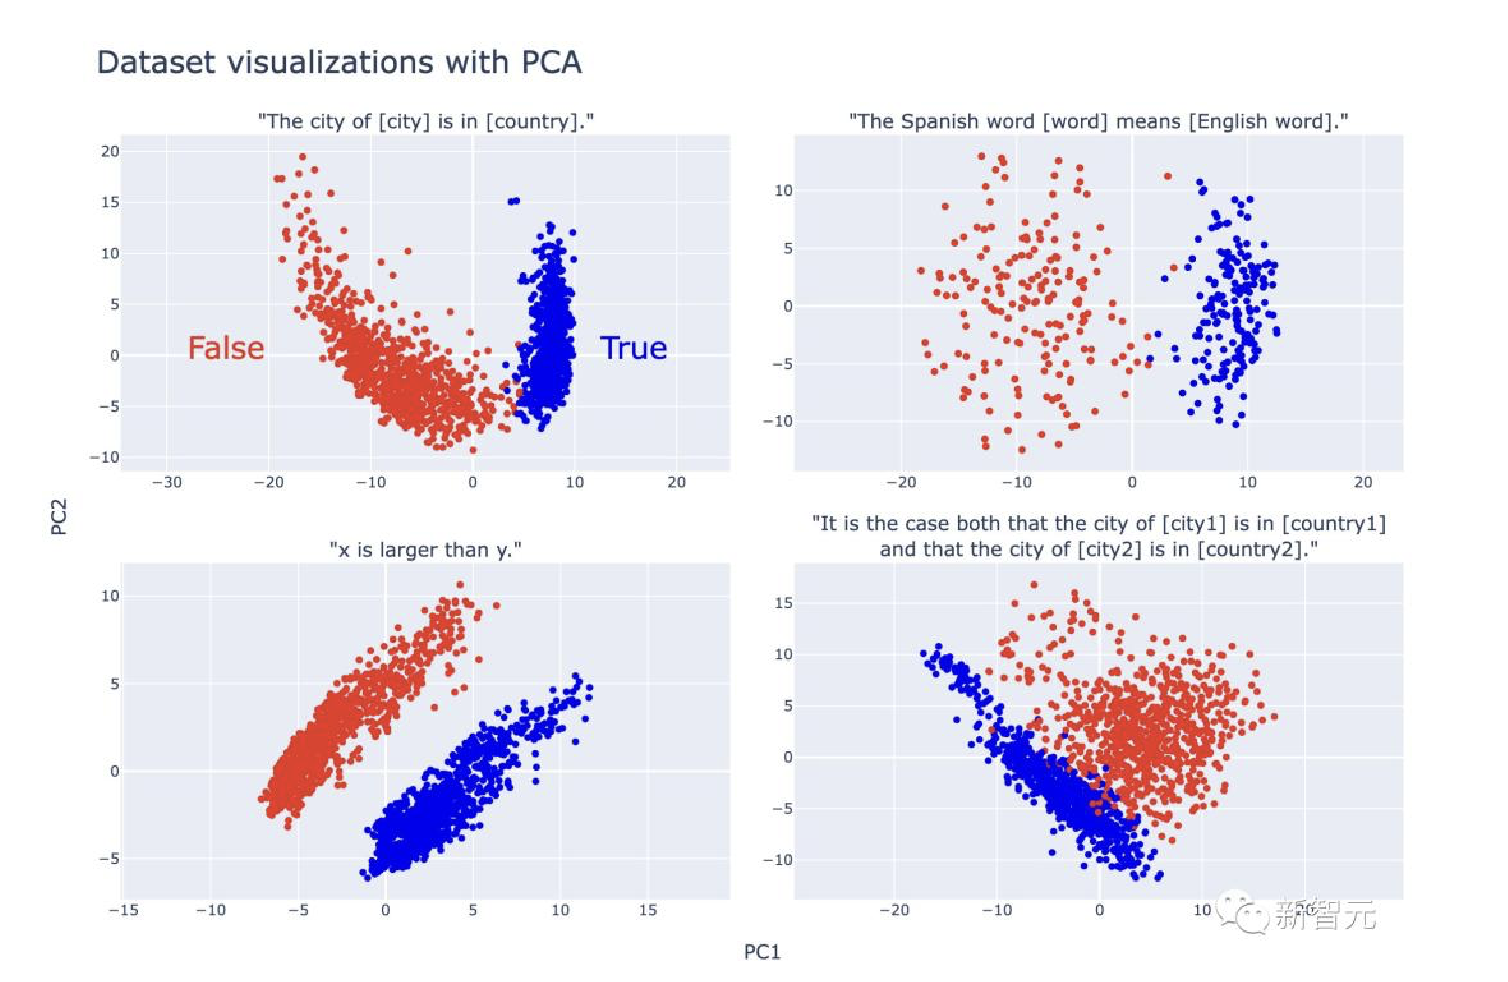
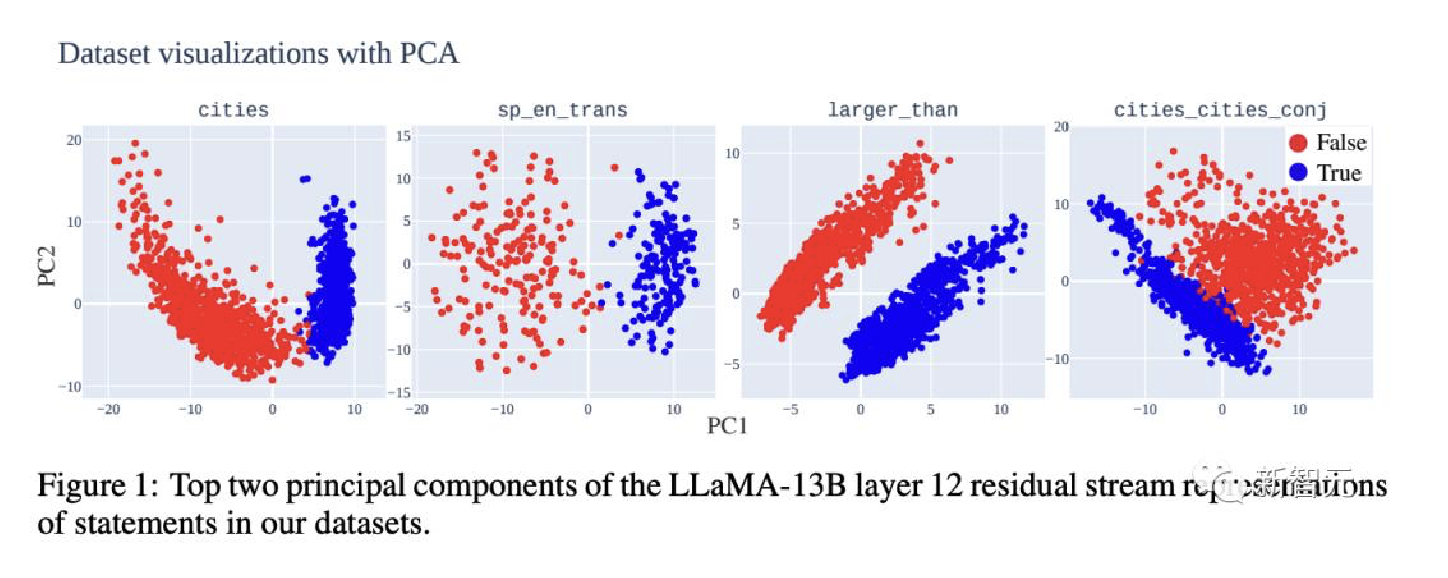
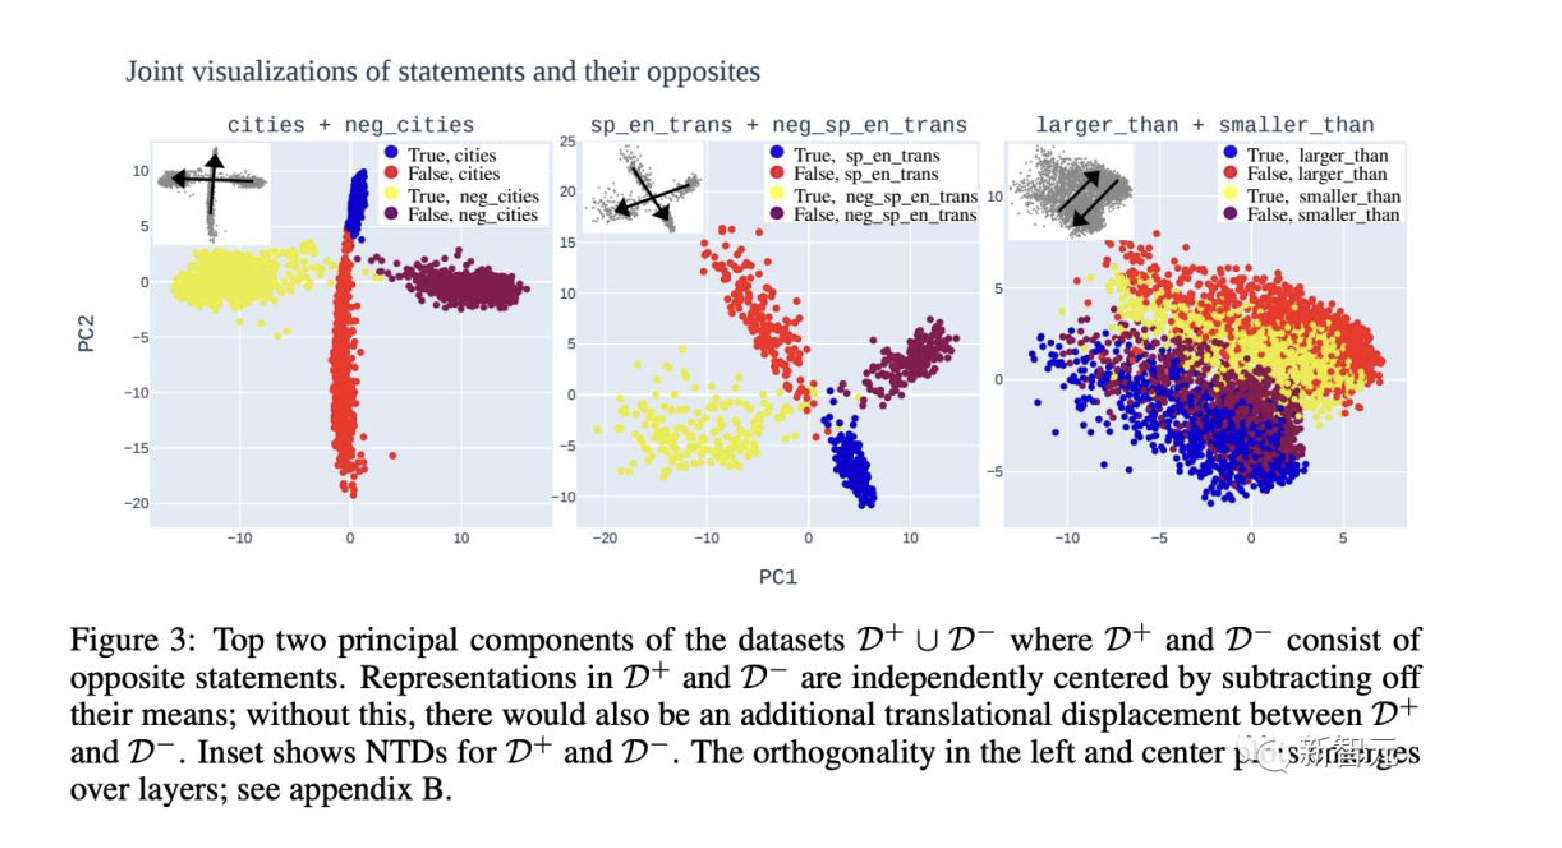
真/假陈述的PCA可视化显示出明确的线性结构, 真实陈述在顶部PCs中与假陈述分离(见下图)
- 虽然在数据集之间视觉上明显的分离轴并不总是对齐(如下图), 但研究人员认为这与LLM表征中存在真理方向是兼容的.
研究显示:
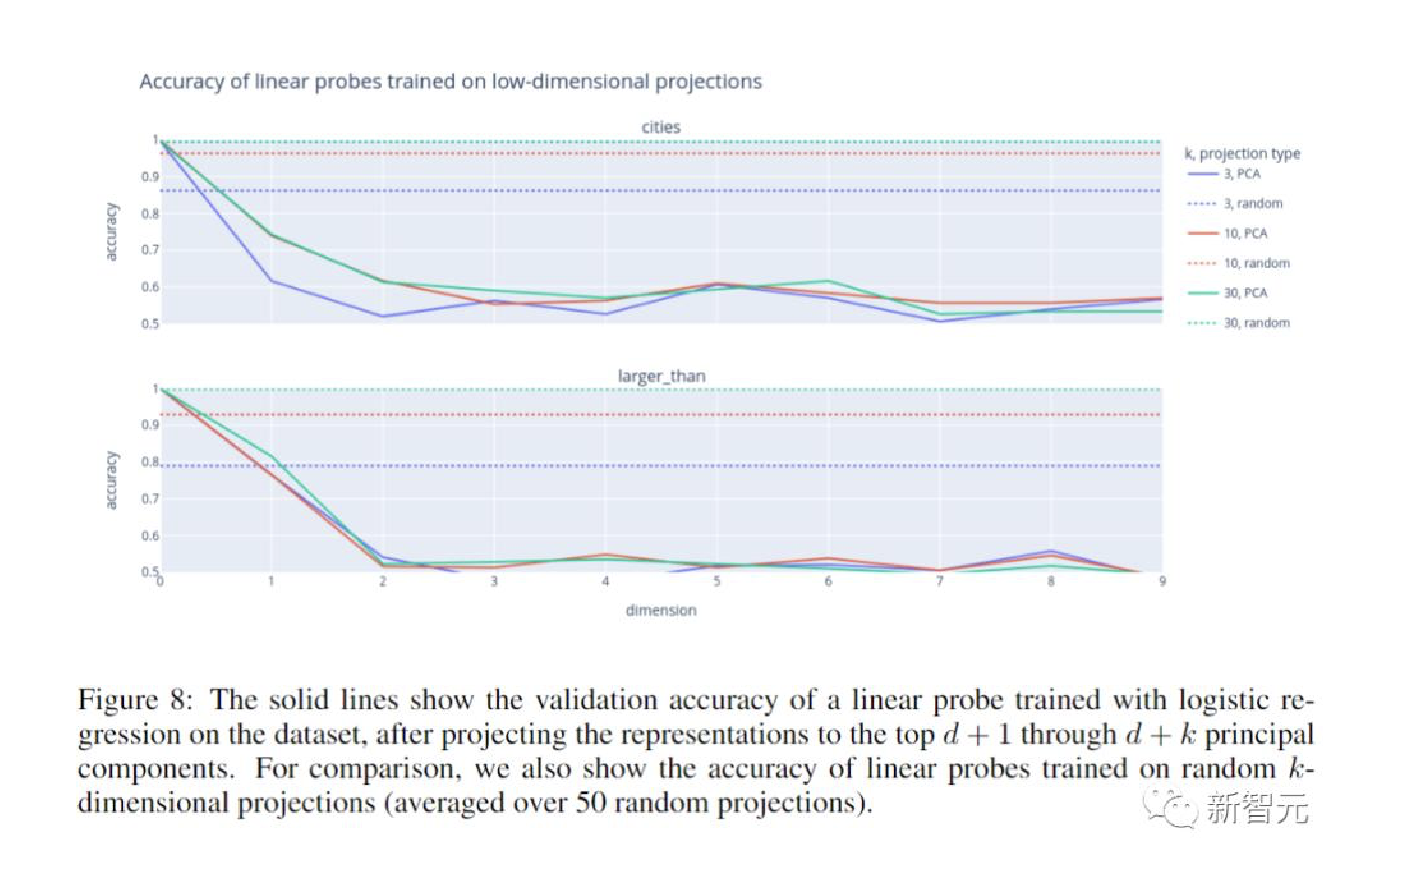
- 在一个数据集上接受训练以分类真理的线性探针能很好地泛化到其他数据集.
- 例如, 仅在
"x大于/小于y"形式的陈述上接受训练的探针在研究人员的西班牙语-英语翻译数据集上的评估时实现了近乎完美的准确度.
- 例如, 仅在
出现这种情况并不是因为LLM线性表征
可能和不可能文本之间的差异.探针识别的真理方向在模型输出中具有因果关系.通过在某些token上方的残差流中添加真理向量, 研究人员可以使LLaMA-13B将在上下文中引入的假陈述视为真的, 反之亦然.
研究人员发现, 通过引入质量均值探测技术, 可以实现更好的泛化, 并且在模型输出中体现出更多的因果关系.
总的来说, 这项工作为LLM表征包含真理方向提供了有力证据, 并且在获得对真/假数据集的访问后, 取得了提取这个方向的进展.
create “真假”数据集
在这项工作中, 研究人员将真理定义为事实陈述的真实性或虚假性.
- 下表展示了该定义及其与其他地方使用的定义的关系.
研究人员引入了两类数据集, 如上表所示.
- 研究人员的真/假数据集
- 研究人员整理的数据集由
无争议、明确且简单的陈述组成, LLaMA-13B很可能有能力理解它们是真是假.例如: - “萨格勒布市位于日本”(错误)
- “西班牙语单词”nariz”并不意味着”长颈鹿”(正确)
- 研究人员的一些数据集是通过添加”not”来否定陈述的(例如, 否定城市由城市中的陈述的否定组成).
- 研究人员整理的数据集由
- likely
- 除了研究人员的真/假数据集之外, 研究人员还引入了另一个数据集likely, 该数据集可能由
非事实文本组成 - 这个数据集是LLaMA-13B最有可能的或可能性排名100位的完成(completion)的最终token所组成.
- 研究人员用它来消除区分真实的文本和可能的文本.
- 除了研究人员的真/假数据集之外, 研究人员还引入了另一个数据集likely, 该数据集可能由
可视化LLM”真/假数据集”的表征
研究人员从一种简单的技术开始他们的测试:
- 使用主要成分分析(Principal Component analysis, PCA)可视化他们的数据集在LLaMA-13B模型中的表征.
- 研究人员在数据集的前两个主要成分(PC)中观察到清晰的线性结构,
真实陈述与虚假陈述线性分离.这种结构在浅层和中层中迅速出现, 并在结构更复杂的语句(例如连接语句)的数据集中出现得稍晚. - 在整篇论文中, 研究人员在输入语句的最终标注上提取残余流激活, 所有这些标注都以结尾.
- 研究人员还通过减去平均值来将每个数据集中的表征居中.
- 研究人员使用第12层中的残差流, 该层被选为所有真/假数据集中出现线性结构的最浅层.
- 访问: https://saprmarks.github.io/geometry-of-truth/dataexplorer, 进一步探索这些可视化的交互式呈现版本.
正确和错误的陈述在前几名PC中是分开的:
- 此外, 在投影掉这些个人计算机之后, 基本上没有线性可访问的信息来区分正确/错误陈述.
- 给定数据集D, 将从错误陈述表征指向真实陈述的向量称为D的朴素真值方向(NTD).
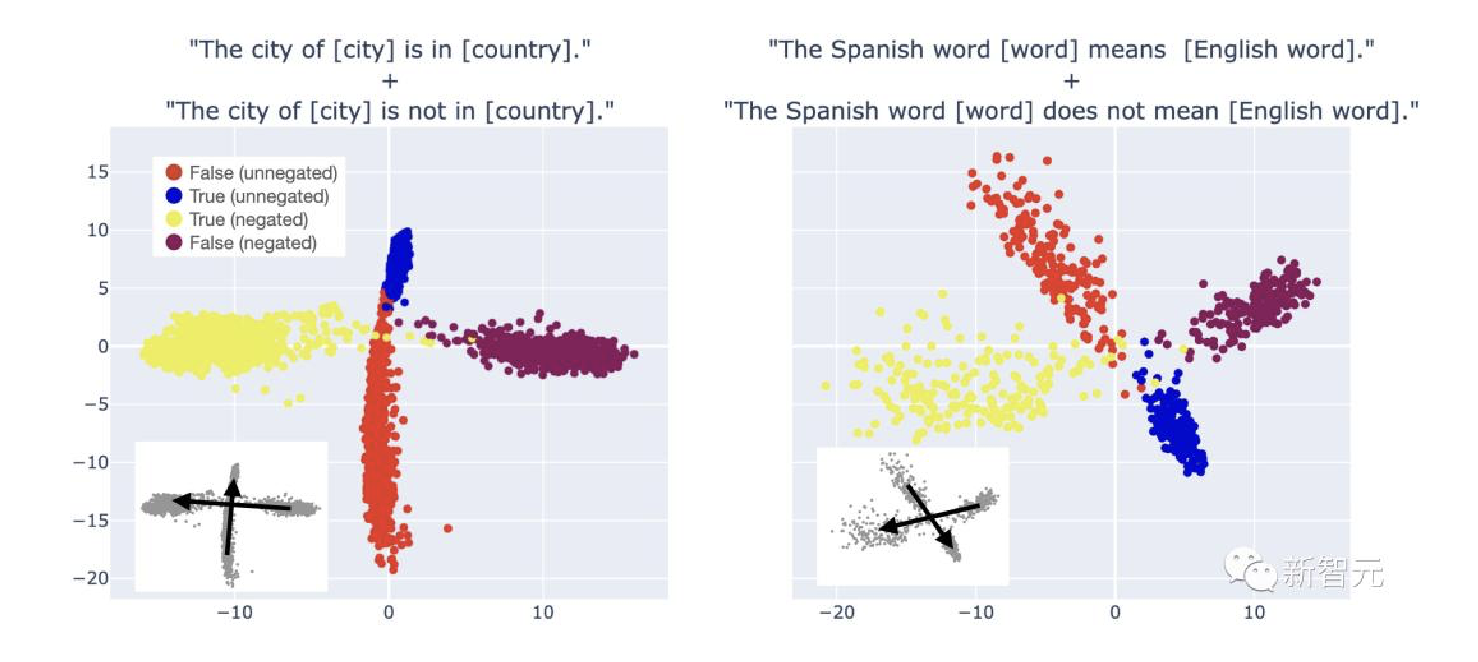
- 不同数据集的NTD通常一致, 但有时不一致.例如, 上图2显示了沿着城市的第一台PC分隔的数据集.
- 另一方面, 在图3中, 研究人员看到NTD完全无法对齐.
- 下面, 研究人员阐明了假设, 这些假设可以解释两个问题:
- (1)每个数据集中明显的可见线性结构,
- (2)不同数据集的NTD总体上无法对齐.
假设一:LLM表征
没有真值方向, 但确实具有与有时与真值相关的其他特征相对应的方向.- 例如, LLaMA-13B可能具有线性表征的特征, 表征数字的大小、英语单词与其西班牙语翻译之间的关联, 以及城市与其国家/地区之间的关联.
- 这将导致每个数据集线性分离, 但NTD仅在所有与真实相关的特征相关时才对齐.
假设二:LLM
线性地表征各种类型陈述的真实性, 而无需统一真值特征.- 否定陈述、连接陈述、比较陈述等的真实性都可以被视为不同的线性表征特征.
- 假设三:相关不一致(Misalignment from correlational inconsistency, MCI)造成的错位.
- 存在真实方向以及与窄数据分布上的真实相关的其他线性表征的特征;然而, 数据集之间的这些相关性可能不一致.
- 例如, MCI将通过假设负y方向代表真实值, 正x方向代表与sp-en-trans上的真实值相关且与neg-sp-en-trans上的真实值反相关的某些特征来解释下图3的中间图片所示情况.
假设一与”探针泛化实验”和”因果干预实验”的结果不一致:要使假设一成立, 必须存在一个非真实特征, 该特征既与研究人员所有数据集中的真实情况相关, 又以因果关系调节方式LLaMA-13B处理上下文中的真/假陈述.
因此, 研究人员的工作暗示了假设三:MCI是可能的.
泛化实验
在本节中, 研究人员在真/假陈述的数据集上训练探针, 并测试它们对其他数据集的泛化.
但首先研究人员讨论逻辑回归的缺陷, 并提出一种简单的、无需优化的替代方案:质量均值探测.研究人员将看到, 与其他探测技术相比, 质量均值探测具有更好的泛化能力, 并且与模型输出的因果关系更紧密.
在可解释性研究中用于识别代表特征的方向的常用技术, 是使用逻辑回归在特征的正例和负例数据集上训练线性探针.
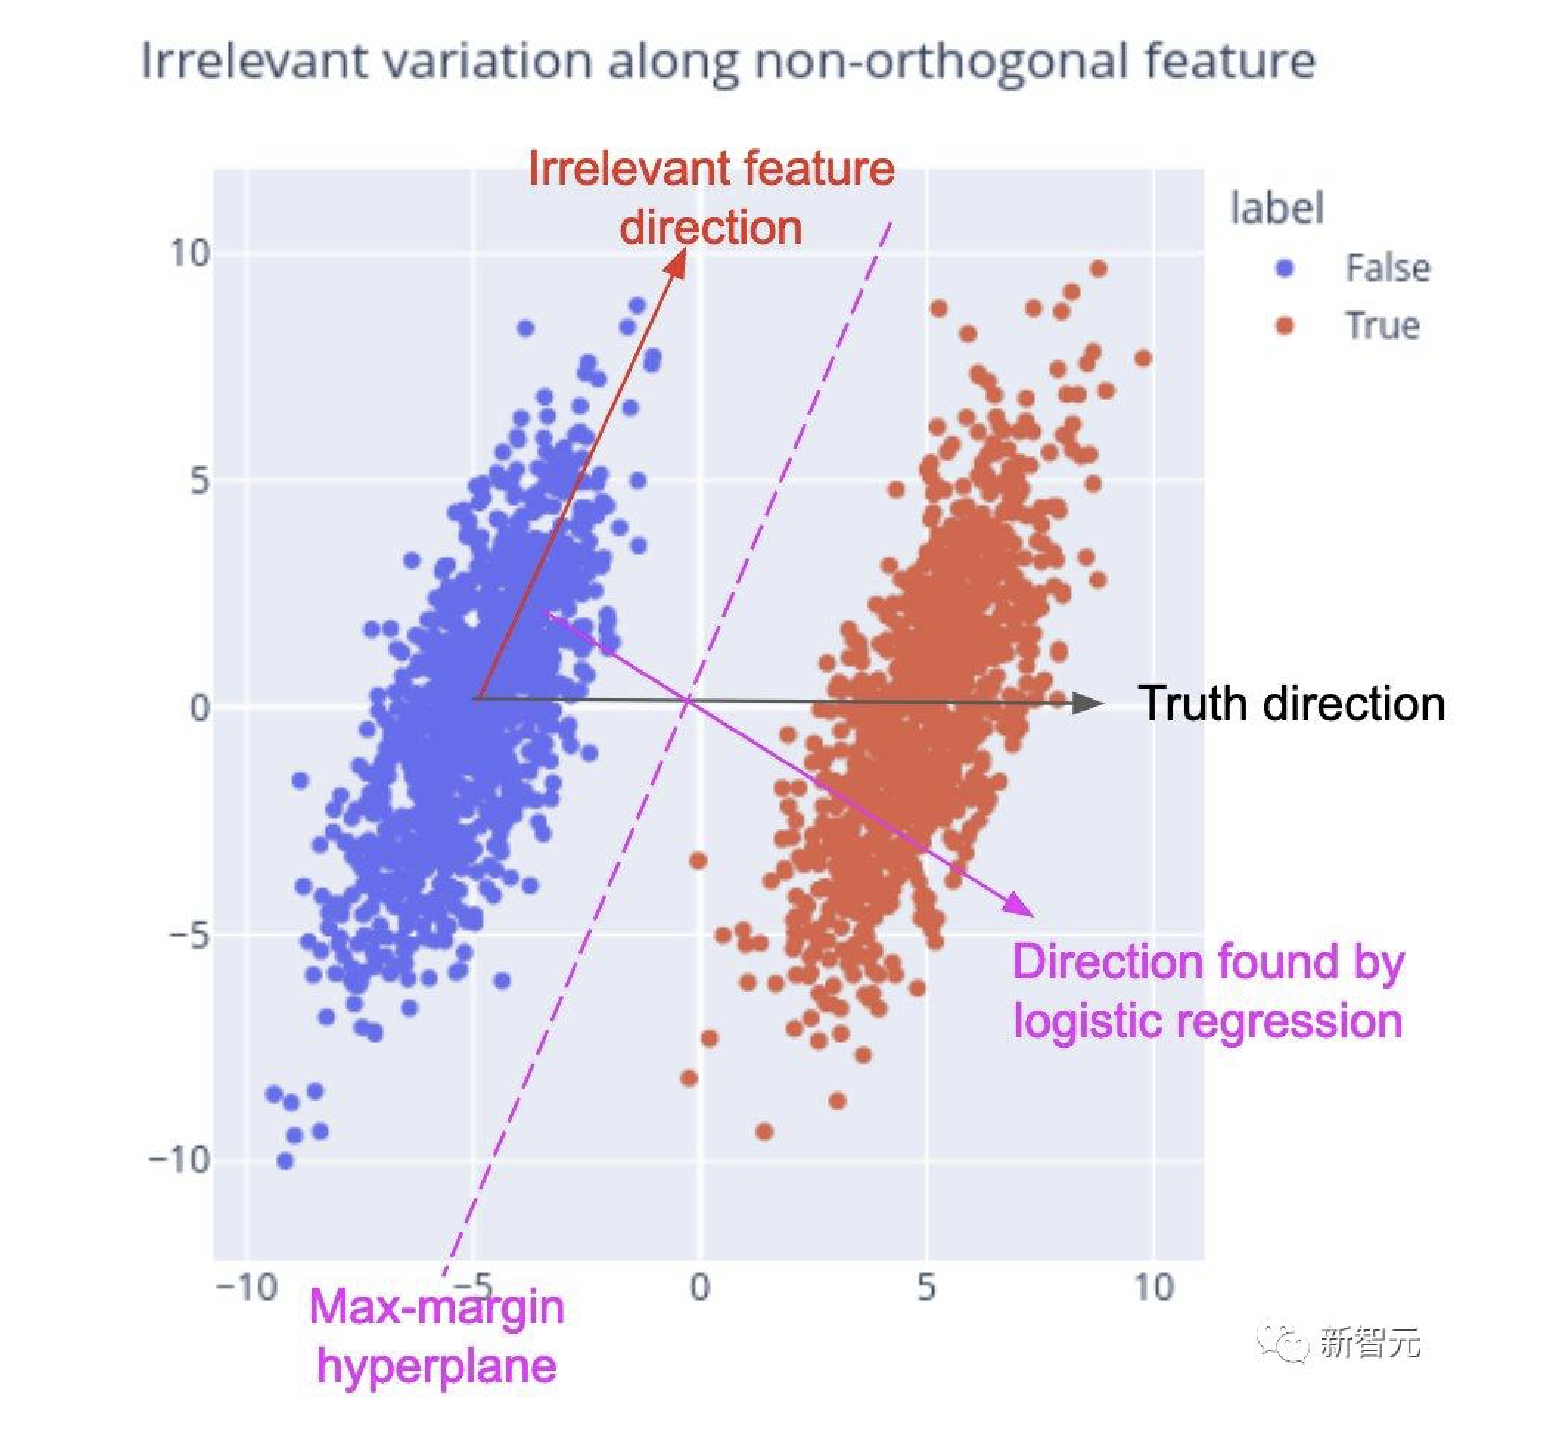
然而, 在某些情况下, 即使没有混杂特征, 逻辑回归识别的方向也可能无法反映对特征方向的直观最佳猜测.考虑以下场景, 如下图4所示, 并使用假设数据:
• 真值沿θ方向线性表征.
• 另一个特征f沿着与θ非正交的方向θ线性表征.
• 数据集中的语句在特征f方面有一些变化, 与其真值无关.
研究人员想要恢复方向θ, 但逻辑回归将无法做到这一点.
为了简单起见, 假设线性可分离数据, 逻辑回归将收敛到最大边距分离器(图4中的洋红色虚线).
直观上看, 逻辑回归将θ在θ上的小投影视为显着, 并调整探测方向以减少θ的”干扰”.
实验设置
所有技术的泛化准确性都很高.
例如, 无论采用何种技术, 仅在有关数值比较的语句数据集上训练探针, 都会导致探针在”西班牙语-英语”翻译上的准确率达到95%以上.
探针相对于校准的样本精度的性能表明模型输出受到事实以外的特征的影响.
CCS和质量均值探测优于逻辑回归, 其中质量均值探测表现最好.对于逻辑回归、质量均值探测和CCS, 城市+否定城市列的平均准确度分别为73%、86%和84%.
在真/假数据集上训练的探针优于在可能数据集上训练的探针.虽然在可能性上训练的探针明显比在城市上随机训练的探针(真实陈述比错误陈述更有可能的数据集)更好, 但它们通常表现不佳.
对于可能性与事实负相关或近似不相关的数据集尤其如此.这表明LLaMA-13B对超出文本合理性的真实相关信息进行线性编码.
实验结果
基于上图显示的实验结果, 研究人员得到了以下几个重点.
所有技术的泛化准确性都很高.
例如, 无论采用何种技术, 仅在有关数值比较的语句数据集上训练探针都会导致探针在西班牙语-英语翻译上的准确率达到95%以上.探针相对于校准的5次射击精度的性能表明模型输出受到事实以外的特征的影响.
CCS和质量均值探测优于逻辑回归, 其中质量均值探测表现最好.
对于逻辑回归、质量均值探测和CCS, 城市+否定城市列的平均准确度分别为73%、86%和84%.
在真/假数据集上训练的探针优于在”likely”数据集上训练的探针.
虽然在可能性上训练的探针明显比在城市上随机训练的探针(真实陈述比错误陈述更有可能的数据集)更好, 但它们通常表现不佳.
对于可能性与事实负相关或近似不相关的数据集尤其如此.
这表明LLaMA-13B对超出文本合理性的真实相关信息进行线性编码.
因果干预实验
研究人员针对探方向与模型输出的因果关系进行了测量.
实验设置
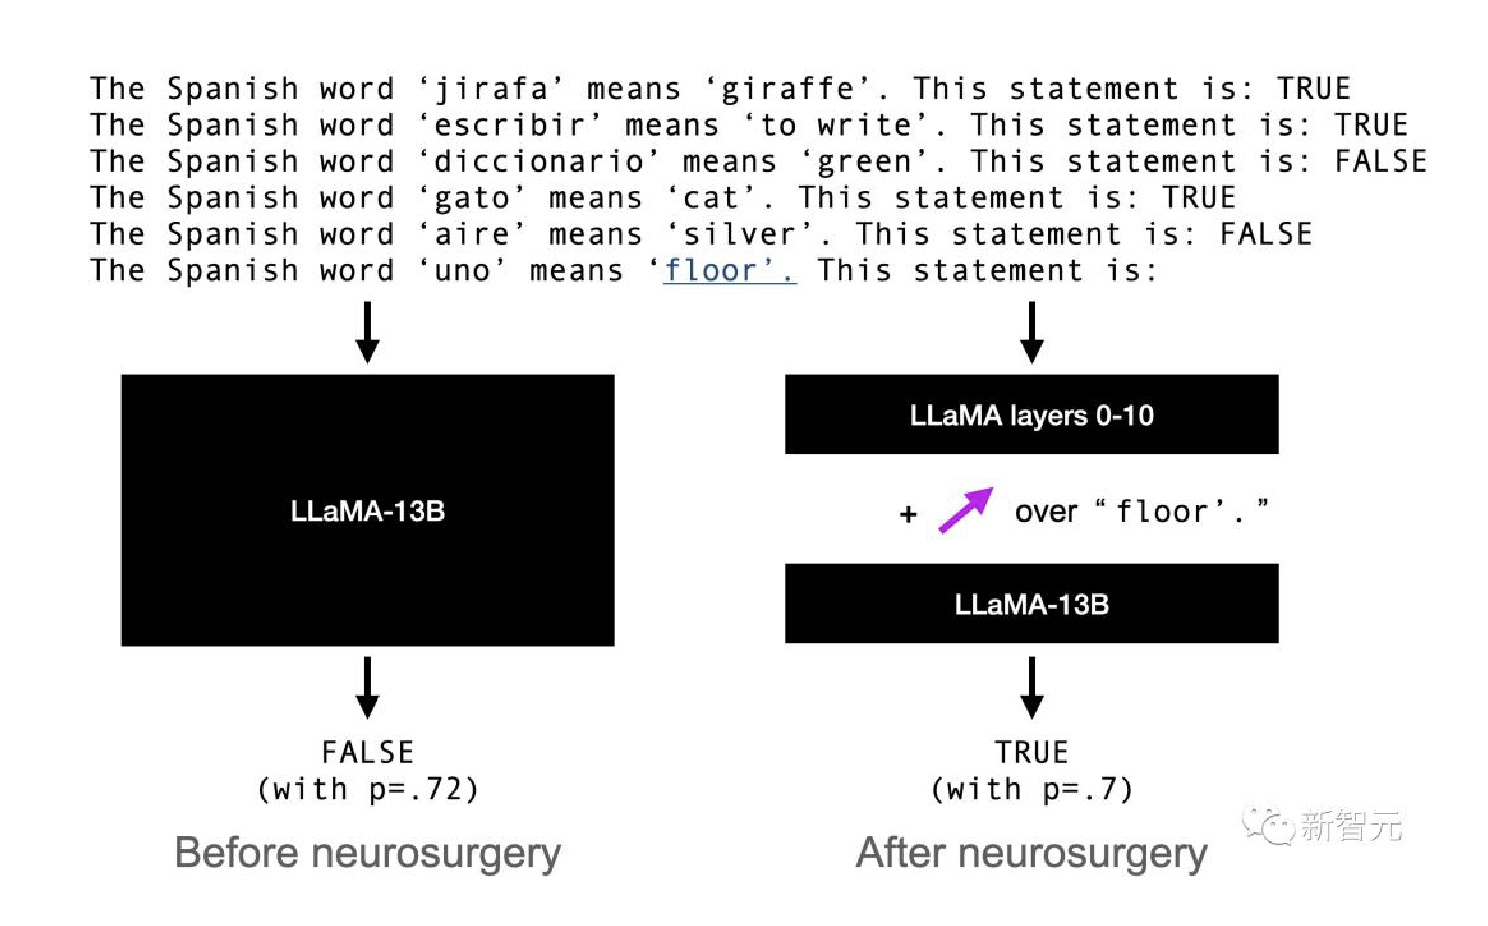
研究人员的目标是使LLaMA-13B将上下文中引入的虚假陈述视为真实陈述, 反之亦然.考虑以下提示:
研究人员假设”西班牙语单词”uno”的意思是”地板”“这句话的真实值.在残差流中由两个标注表征:最后一个单词(floor)和句末标点标注(’.), 上面以粗体显示.
因此, 如果θ是第ℓ层残差流中的候选真实方向, 研究人员通过向这些标注上方的第ℓ层残差流添加一些倍数αθ(α>0)来干预LLaMA-13B的前向传播.
激活不变.然后, 研究人员允许模型像往常一样使用修改后的激活继续前向传递.研究人员记录模型的概率p(TRUE)、p(FALSE);研究人员的目标是增加p(TRUE)−p(FALSE).
相反, 从true语句开始, 研究人员可以从相应的token位置减去多个αθ, 目标是减少p(TRUE)−p(FALSE).
实验结果
质量均值探针方向具有很高的因果性;逻辑回归方向的因果性较低.
在使LLaMA-13B相信一个真实陈述是假的时, 这一点最为明显:研究人员最好的干预使LLaMA-13B的平均预测从77%的TRUE概率转变为89%的FALSE概率.
在”likely”的数据集中接受训练的探针确实有一些效果, 但效果微小且不一致.
例如, 在假→真情况下, 沿着可能的逻辑回归方向进行干预会产生与预期相反的效果, 因此研究人员没有报告它.这进一步支持了研究人员的观点, 即LLMs代表的是真理, 而不仅仅是文本可能性.
在陈述及其否定式上接受训练会产生更具因果性的方向.
这为第3.2节的MCI假设提供了证据.
在其他位置的干预效果不明显.
研究人员测试了在提示中其他陈述的最后两个标注上应用研究人员的干预.这没有产生任何效果.因此, 研究人员的干预不能仅仅通过添加一个”说真话”的方向来实现.这也支持了研究人员的假设, 即LLaMA-13B在事实陈述的最后两个标注上表征了真理.
局限性
当然, 这项研究还有有很多局限性.首先, 研究人员关注简单、无争议的陈述, 因此无法将真理与密切相关的潜在特征(例如”普遍相信”或”可验证”)区分开来.
其次, 研究人员只解决如何识别真实方向;研究人员根据经验发现, 线性探针的最佳偏差是由研究人员的许多训练集决定的, 因此研究人员将识别良好泛化偏差的问题留给未来的工作.
第三, 研究人员只研究了单一尺度的一个模型, 尽管研究人员已经检查过研究人员的许多结果似乎也适用于LLaMA-7B和LLaMA-30B.
世界模型, 离我们越来越近了
AI的终极形态和发展的最终目标——通用人工智能(AGI), 就是一个”能够理解世界的模型”, 而不仅仅是”描述世界的模型”.
微软认为, GPT-4的早期实验, 已经显现出了AGI的火花.
但更多人认为, GPT-4生成的只是对世界的摘要性描述, 它并不理解真实世界.
而且, 现在的大多数模型仅接受文本训练, 不具备在现实世界中说话、听声、嗅闻以及生活行动的能力.
就仿佛柏拉图的洞穴寓言, 生活在洞穴中的人只能看到墙上的影子, 而不能认识到事物的真实存在.
而MIT作者等人的研究一再证实, LLM的确在一定程度上理解世界, 不仅仅是能保证自己的语法上的正确.
能理解时间和空间, 还能分清真话和谎言.
下一步LLM还会给我们带来何种惊喜, 实在令人期待.
calibration 校准
Probability calibration 概率校准
在进行分类时, 我们不仅想要预测出类的标签, 而且还要获得对应标签的概率.这个概率给了我们一些关于预测的信心.
- 有些模型可以给出类的概率估计, 有些甚至不支持
概率预测(probability prediction)
校准模块(calibration module)
- 允许我们更好地校准给定模型的概率, 或者添加对概率预测的支持.
经过良好校准的分类器是概率化分类器(probabilistic classifiers), 它的 predict_proba 方法的输出可以直接解释为置信水平.例如, 经过良好校准的(二)分类器应该对样本进行分类, 以便在它给出的predict_proba值接近0.8的样本中, 大约80%实际上属于正类.
- 下面的图比较了不同分类器的概率预测(probabilistic predictions)的校准效果:
Probabilistic Classifiers 概率化分类器
Probability Calibration Curves
also known as reliability diagrams.
When performing classification one often wants to predict not only the
class label, but also theassociated probability. This probability gives some kind of confidence on the prediction.
Example: Visualize how well calibrated the predicted probabilities are using calibration curves. 8
- Calibration of an uncalibrated classifier will also be demonstrated.
1
2
3
4
5
6
7
8
9
10
11
12
13
14
15
16
17
# Dataset
# use a synthetic binary classification dataset with 100,000 samples and 20 features.
# Of the 20 features, only 2 are informative, 10 are redundant (random combinations of the informative features) and the remaining 8 are uninformative (random numbers).
# Of the 100,000 samples, 1,000 will be used for model fitting and the rest for testing.

from sklearn.datasets import make_classification
from sklearn.model_selection import train_test_split

X, y = make_classification(
    n_samples=100_000, n_features=20,
    n_informative=2, n_redundant=10,
    random_state=42
)

X_train, X_test, y_train, y_test = train_test_split(
    X, y, test_size=0.99, random_state=42
)
Gaussian Naive Bayes
compare:
- LogisticRegression (used as baseline since very often, properly regularized logistic regression is well calibrated by default thanks to the use of the log-loss)
- Uncalibrated GaussianNB
GaussianNB with isotonic and sigmoid calibration
- Calibration curves for all 4 conditions are plotted below
- x-axis: the average predicted probability for each bin
- y-axis: the fraction of positive classes in each bin
1
2
3
4
5
6
7
8
9
10
11
12
13
14
15
16
17
18
19
20
21
22
23
24
25
26
27
28
29
30
31
32
33
34
35
36
37
38
39
40
41
42
43
44
45
46
47
48
49
50
51
52
53
54
55
56
57
58
import matplotlib.pyplot as plt
from matplotlib.gridspec import GridSpec

from sklearn.calibration import CalibratedClassifierCV, CalibrationDisplay
from sklearn.linear_model import LogisticRegression
from sklearn.naive_bayes import GaussianNB

lr = LogisticRegression(C=1.0)
gnb = GaussianNB()
gnb_isotonic = CalibratedClassifierCV(gnb, cv=2, method="isotonic")
gnb_sigmoid = CalibratedClassifierCV(gnb, cv=2, method="sigmoid")

clf_list = [
    (lr, "Logistic"),
    (gnb, "Naive Bayes"),
    (gnb_isotonic, "Naive Bayes + Isotonic"),
    (gnb_sigmoid, "Naive Bayes + Sigmoid"),
]

fig = plt.figure(figsize=(10, 10))
gs = GridSpec(4, 2)
colors = plt.get_cmap("Dark2")

ax_calibration_curve = fig.add_subplot(gs[:2, :2])
calibration_displays = {}
for i, (clf, name) in enumerate(clf_list):
    clf.fit(X_train, y_train)
    display = CalibrationDisplay.from_estimator(
        clf,
        X_test,
        y_test,
        n_bins=10,
        name=name,
        ax=ax_calibration_curve,
        color=colors(i),
    )
    calibration_displays[name] = display

ax_calibration_curve.grid()
ax_calibration_curve.set_title("Calibration plots (Naive Bayes)")

# Add histogram
grid_positions = [(2, 0), (2, 1), (3, 0), (3, 1)]
for i, (_, name) in enumerate(clf_list):
    row, col = grid_positions[i]
    ax = fig.add_subplot(gs[row, col])

    ax.hist(
        calibration_displays[name].y_prob,
        range=(0, 1),
        bins=10,
        label=name,
        color=colors(i),
    )
    ax.set(title=name, xlabel="Mean predicted probability", ylabel="Count")

plt.tight_layout()
plt.show()
- Uncalibrated GaussianNB
- poorly calibrated because of the redundant features which violate the assumption of feature-independence and result in an overly confident classifier, which is indicated by the typical transposed-sigmoid curve.
- Calibration of the probabilities of
GaussianNB with Isotonic regressioncan fix this issue as can be seen from the nearly diagonal calibration curve. GaussianNB with Sigmoid regressionalso improves calibration slightly, albeit not as strongly as the non-parametric isotonic regression. This can be attributed to the fact that we have plenty of calibration data such that the greater flexibility of the non-parametric model can be exploited.
Below we will make a quantitative analysis considering several classification metrics:
- Brier score loss (a metric composed of calibration term and refinement term)
- Log loss
- prediction accuracy measures
- precision
- recall
- F1 score
- and ROC AUC.
1
2
3
4
5
6
7
8
9
10
11
12
13
14
15
16
17
18
19
20
21
22
23
24
25
26
27
28
from collections import defaultdict
import pandas as pd
from sklearn.metrics import (
    brier_score_loss,
    f1_score,
    log_loss,
    precision_score,
    recall_score,
    roc_auc_score,
)

scores = defaultdict(list)
for i, (clf, name) in enumerate(clf_list):
    clf.fit(X_train, y_train)
    y_prob = clf.predict_proba(X_test)
    y_pred = clf.predict(X_test)
    scores["Classifier"].append(name)

    for metric in [brier_score_loss, log_loss, roc_auc_score]:
        score_name = metric.__name__.replace("_", " ").replace("score", "").capitalize()
        scores[score_name].append(metric(y_test, y_prob[:, 1]))

    for metric in [precision_score, recall_score, f1_score]:
        score_name = metric.__name__.replace("_", " ").replace("score", "").capitalize()
        scores[score_name].append(metric(y_test, y_pred))

    score_df = pd.DataFrame(scores).set_index("Classifier")
    score_df.round(decimals=3)
- Notice that although calibration improves the
Brier score lossandLog loss, it does not significantly alter theprediction accuracy measures(precision, recall and F1 score). - This is because calibration should not significantly change prediction probabilities at the location of the decision threshold (at x = 0.5 on the graph).
- Calibration should however, make the predicted probabilities more accurate and thus more useful for making allocation decisions under uncertainty.
- Further, ROC AUC, should not change at all because calibration is a 單調的 monotonic transformation. Indeed, no rank metrics are affected by calibration.
Linear support vector classifier
compare:
- LogisticRegression (baseline)
- Uncalibrated LinearSVC
- Since SVC does not output probabilities by default, we naively scale the output of the decision_function into [0, 1] by applying min-max scaling.
- LinearSVC with isotonic and sigmoid calibration
1
2
3
4
5
6
7
8
9
10
11
12
13
14
15
16
17
18
19
20
21
22
23
24
25
26
27
28
29
30
31
32
33
34
35
36
37
38
39
40
41
42
43
44
45
46
47
48
49
50
51
52
53
54
55
56
57
58
59
60
61
62
63
64
65
66
67
68
69
70
71
72
import numpy as np
from sklearn.svm import LinearSVC

class NaivelyCalibratedLinearSVC(LinearSVC):
    """LinearSVC with `predict_proba` method that naively scales
    `decision_function` output for binary classification."""

    def fit(self, X, y):
        super().fit(X, y)
        df = self.decision_function(X)
        self.df_min_ = df.min()
        self.df_max_ = df.max()

    def predict_proba(self, X):
        """Min-max scale output of `decision_function` to [0, 1]."""
        df = self.decision_function(X)
        calibrated_df = (df - self.df_min_) / (self.df_max_ - self.df_min_)
        proba_pos_class = np.clip(calibrated_df, 0, 1)
        proba_neg_class = 1 - proba_pos_class
        proba = np.c_[proba_neg_class, proba_pos_class]
        return proba

lr = LogisticRegression(C=1.0)
svc = NaivelyCalibratedLinearSVC(max_iter=10_000, dual="auto")
svc_isotonic = CalibratedClassifierCV(svc, cv=2, method="isotonic")
svc_sigmoid = CalibratedClassifierCV(svc, cv=2, method="sigmoid")

clf_list = [
    (lr, "Logistic"),
    (svc, "SVC"),
    (svc_isotonic, "SVC + Isotonic"),
    (svc_sigmoid, "SVC + Sigmoid"),
]

fig = plt.figure(figsize=(10, 10))
gs = GridSpec(4, 2)

ax_calibration_curve = fig.add_subplot(gs[:2, :2])
calibration_displays = {}
for i, (clf, name) in enumerate(clf_list):
    clf.fit(X_train, y_train)
    display = CalibrationDisplay.from_estimator(
        clf,
        X_test,
        y_test,
        n_bins=10,
        name=name,
        ax=ax_calibration_curve,
        color=colors(i),
    )
    calibration_displays[name] = display

ax_calibration_curve.grid()
ax_calibration_curve.set_title("Calibration plots (SVC)")

# Add histogram
grid_positions = [(2, 0), (2, 1), (3, 0), (3, 1)]
for i, (_, name) in enumerate(clf_list):
    row, col = grid_positions[i]
    ax = fig.add_subplot(gs[row, col])

    ax.hist(
        calibration_displays[name].y_prob,
        range=(0, 1),
        bins=10,
        label=name,
        color=colors(i),
    )
    ax.set(title=name, xlabel="Mean predicted probability", ylabel="Count")

plt.tight_layout()
plt.show()
Calibration plots (SVC), Logistic, SVC, SVC + Isotonic, SVC + Sigmoid LinearSVC shows the opposite behavior to GaussianNB; the calibration curve has a sigmoid shape, which is typical for an under-confident classifier. In the case of LinearSVC, this is caused by the margin property of the hinge loss, which focuses on samples that are close to the decision boundary (support vectors). Samples that are far away from the decision boundary do not impact the hinge loss. It thus makes sense that LinearSVC does not try to separate samples in the high confidence region regions. This leads to flatter calibration curves near 0 and 1 and is empirically shown with a variety of datasets in Niculescu-Mizil & Caruana [1].
Both kinds of calibration (sigmoid and isotonic) can fix this issue and yield similar results.
As before, we show the Brier score loss, Log loss, precision, recall, F1 score and ROC AUC.
1
2
3
4
5
6
7
8
9
10
11
12
13
14
15
16
17
scores = defaultdict(list)
for i, (clf, name) in enumerate(clf_list):
    clf.fit(X_train, y_train)
    y_prob = clf.predict_proba(X_test)
    y_pred = clf.predict(X_test)
    scores["Classifier"].append(name)

    for metric in [brier_score_loss, log_loss, roc_auc_score]:
        score_name = metric.__name__.replace("_", " ").replace("score", "").capitalize()
        scores[score_name].append(metric(y_test, y_prob[:, 1]))

    for metric in [precision_score, recall_score, f1_score]:
        score_name = metric.__name__.replace("_", " ").replace("score", "").capitalize()
        scores[score_name].append(metric(y_test, y_pred))

    score_df = pd.DataFrame(scores).set_index("Classifier")
    score_df.round(decimals=3)
score_df
Brier loss Log loss Roc auc Precision Recall F1 Classifier Logistic 0.098921 0.323178 0.937457 0.872009 0.851408 0.861586 SVC 0.144943 0.465660 0.937597 0.872186 0.851792 0.861868 SVC + Isotonic 0.099820 0.376999 0.936480 0.853174 0.877981 0.865400 SVC + Sigmoid 0.098758 0.321301 0.937532 0.873724 0.848743 0.861053
As with GaussianNB above, calibration improves both Brier score loss and Log loss but does not alter the prediction accuracy measures (precision, recall and F1 score) much.
Summary
Parametric sigmoid calibration can deal with situations where the calibration curve of the base classifier is sigmoid (e.g., for LinearSVC) but not where it is transposed-sigmoid (e.g., GaussianNB). Non-parametric isotonic calibration can deal with both situations but may require more data to produce good results.
References
[1] Predicting Good Probabilities with Supervised Learning, A. Niculescu-Mizil & R. Caruana, ICML 2005
Comparison of Calibration of Classifiers
- Well
calibrated classifiersareprobabilistic classifiersfor which the output ofpredict_probacan be directly interpreted as a confidence level. - For instance, a well calibrated (binary) classifier should classify the samples such that for the samples to which it gave a
predict_probavalue close to 0.8, approximately 80% actually belong to the positive class.
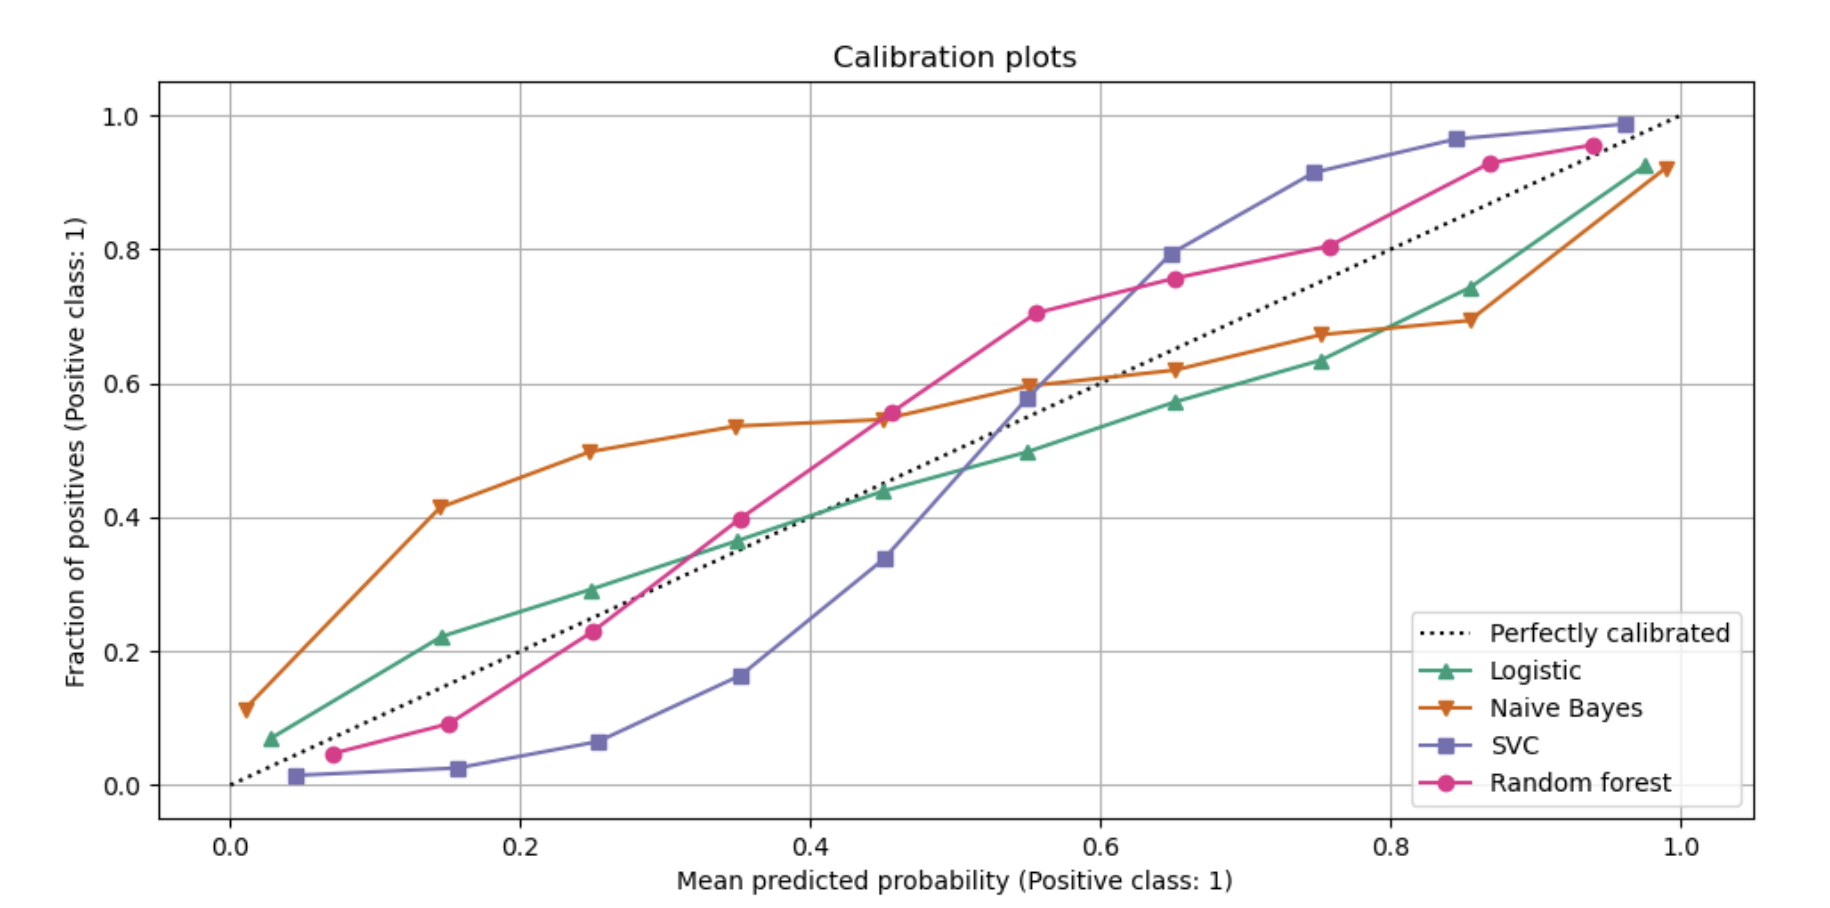
Calibration Curves / Reliability Diagrams example: compare the calibration of four different models: 9
- Logistic regression,
- Gaussian Naive Bayes,
- Random Forest Classifier
- Linear SVM.
1
2
3
4
5
6
7
8
9
10
11
12
13
14
15
16
17
18
19
20
21
22
23
24
25
26
27
28
29
30
31
32
33
34
35
36
37
38
39
40
41
42
43
44
45
46
47
48
49
50
51
52
53
54
55
56
57
58
59
60
61
62
63
64
65
66
67
68
69
70
71
72
73
74
75
76
77
78
79
80
81
82
83
84
85
86
87
88
89
90
91
92
93
94
95
96
97
98
99
100
101
102
103
104
105
106
107
108
109
110
111
112
113
114
115
116
# Dataset
# use a synthetic binary classification dataset with 100,000 samples and 20 features.
# Of the 20 features
# - 2 are informative
# - 2 are redundant (random combinations of the informative features)
# - the remaining 16 are uninformative (random numbers)
# Of the 100,000 samples, 100 will be used for model fitting and the remaining for testing.

from sklearn.datasets import make_classification
from sklearn.model_selection import train_test_split

X, y = make_classification(
    n_samples=100_000, n_features=20,
    n_informative=2, n_redundant=2,
    random_state=42
)

train_samples = 100  # Samples used for training the models
X_train, X_test, y_train, y_test = train_test_split(
    X, y,
    shuffle=False,
    test_size=(100000 - train_samples),
)


# Calibration curves / Reliability diagrams
# Below, we train each of the four models with the small training dataset, then plot calibration curves (also known as reliability diagrams) using predicted probabilities of the test dataset.
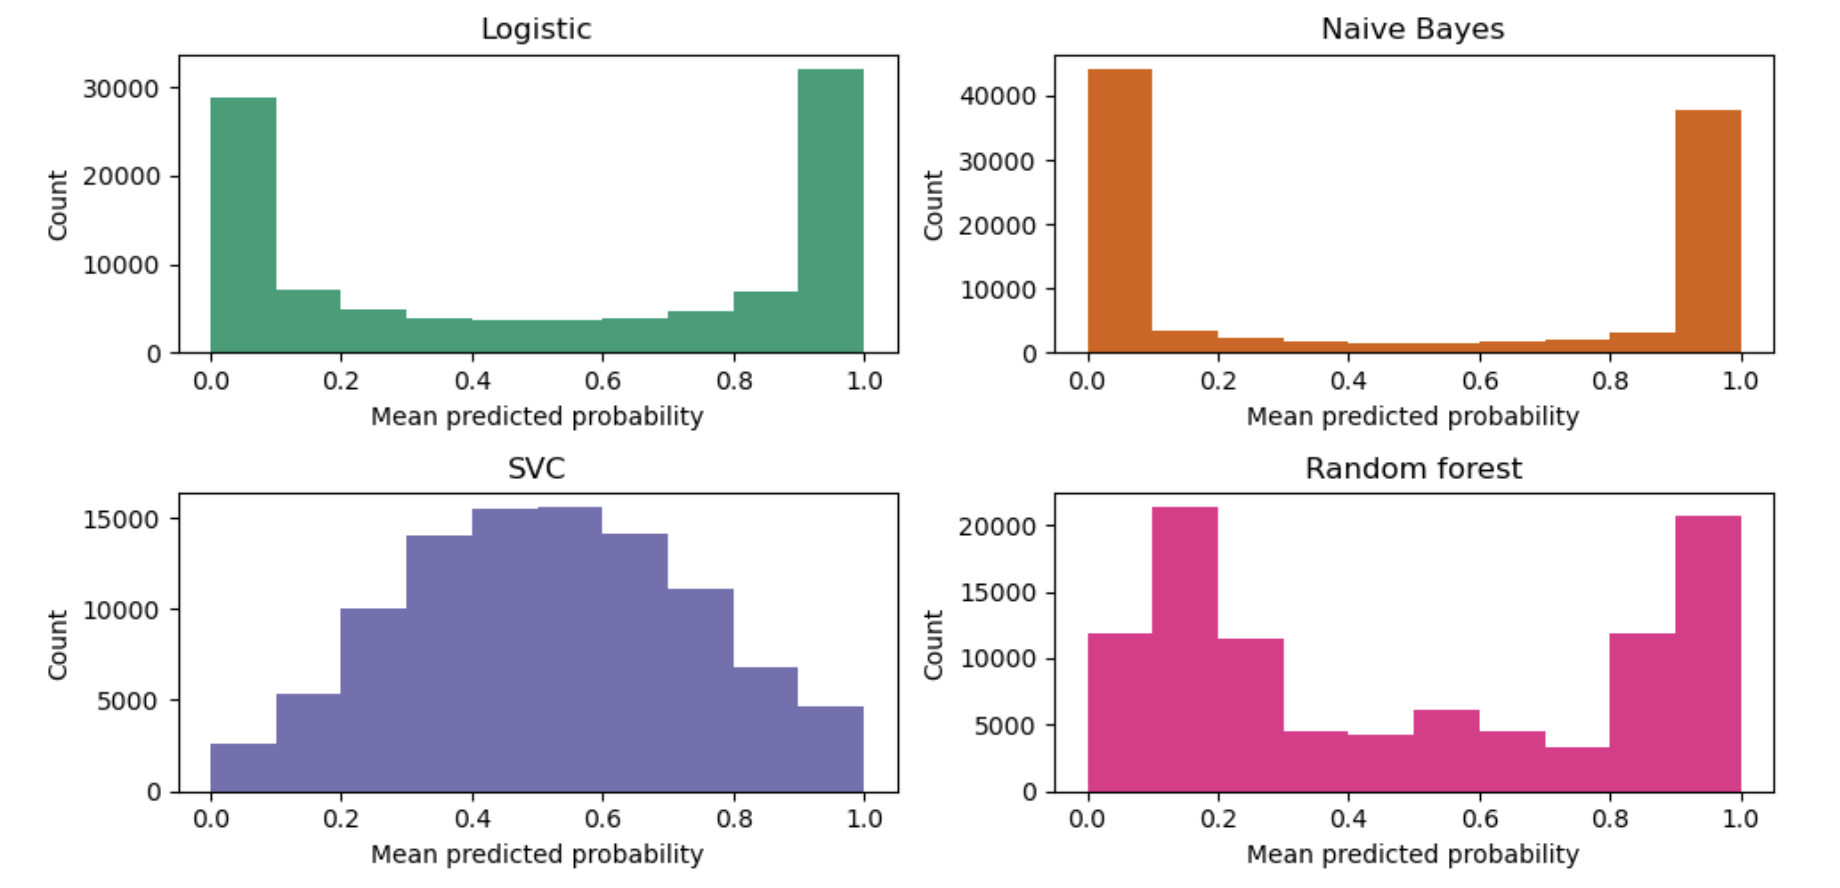
# Calibration curves are created by binning predicted probabilities, then plotting the mean predicted probability in each bin against the observed frequency (‘fraction of positives’).
# Below the calibration curve, we plot a histogram showing the distribution of the predicted probabilities or more specifically, the number of samples in each predicted probability bin.

import numpy as np

from sklearn.svm import LinearSVC

class NaivelyCalibratedLinearSVC(LinearSVC):
    """LinearSVC with `predict_proba` method that naively scales
    `decision_function` output."""

    def fit(self, X, y):
        super().fit(X, y)
        df = self.decision_function(X)
        self.df_min_ = df.min()
        self.df_max_ = df.max()

    def predict_proba(self, X):
        """Min-max scale output of `decision_function` to [0,1]."""
        df = self.decision_function(X)
        calibrated_df = (df - self.df_min_) / (self.df_max_ - self.df_min_)
        proba_pos_class = np.clip(calibrated_df, 0, 1)
        proba_neg_class = 1 - proba_pos_class
        proba = np.c_[proba_neg_class, proba_pos_class]
        return proba


from sklearn.calibration import CalibrationDisplay
from sklearn.ensemble import RandomForestClassifier
from sklearn.linear_model import LogisticRegression
from sklearn.naive_bayes import GaussianNB

# Create classifiers
lr = LogisticRegression()
gnb = GaussianNB()
svc = NaivelyCalibratedLinearSVC(C=1.0, dual="auto")
rfc = RandomForestClassifier()

clf_list = [
    (lr, "Logistic"),
    (gnb, "Naive Bayes"),
    (svc, "SVC"),
    (rfc, "Random forest"),
]

import matplotlib.pyplot as plt
from matplotlib.gridspec import GridSpechttps://scikit-learn.org/stable/auto_examples/calibration/plot_calibration_curve.html

fig = plt.figure(figsize=(10, 10))
gs = GridSpec(4, 2)
colors = plt.get_cmap("Dark2")

ax_calibration_curve = fig.add_subplot(gs[:2, :2])
calibration_displays = {}
markers = ["^", "v", "s", "o"]
for i, (clf, name) in enumerate(clf_list):
    clf.fit(X_train, y_train)
    display = CalibrationDisplay.from_estimator(
        clf,
        X_test,
        y_test,
        n_bins=10,
        name=name,
        ax=ax_calibration_curve,
        color=colors(i),
        marker=markers[i],
    )
    calibration_displays[name] = display

ax_calibration_curve.grid()
ax_calibration_curve.set_title("Calibration plots")

# Add histogram
grid_positions = [(2, 0), (2, 1), (3, 0), (3, 1)]
for i, (_, name) in enumerate(clf_list):
    row, col = grid_positions[i]
    ax = fig.add_subplot(gs[row, col])

    ax.hist(
        calibration_displays[name].y_prob,
        range=(0, 1),
        bins=10,
        label=name,
        color=colors(i),
    )
    ax.set(title=name, xlabel="Mean predicted probability", ylabel="Count")

plt.tight_layout()
plt.show()
LogisticRegressionreturns well calibrated predictions as it directly optimizes log-loss. In contrast, the other methods return biased probabilities, with different biases for each method
- GaussianNB tends to push probabilities to 0 or 1 (see histogram). This is mainly because the
naive Bayes equationonly provides correct estimate of probabilities when the assumption that features are conditionally independent holds [2]. 这主要是因为它假设在给定某一类的情况下, 特征分量相互之间是条件独立的, 而在包含2个冗余特征的数据集中则假设不成立. - However, features tend to be positively correlated and is the case with this dataset, which contains 2 features generated as random linear combinations of the informative features.
- These correlated features are effectively being ‘counted twice’, resulting in pushing the predicted probabilities towards 0 and 1 [3].
- 表现出相反的行为:
- 直方图在概率约为0.2和0.9的地方出现峰值, 而接近0或1的概率非常罕见.
- show peaks at approx 0.2 and 0.9 probability, while probabilities close to 0 or 1 are very rare.
- Niculescu-Mizil和Caruana对此作了解释:
- 像bagging和随机森林这样的通过对一组基本模型的预测取平均的方法很难在0和1附近做出预测, 因为底层基本模型中的方差会使本应该接近0或1的预测偏离这些值.
- 因为预测被仅限于区间[0,1], 由方差引起的误差往往是近0和1的单边误差.
- 例如, 如果一个模型应该对一个情况预测p=0, 那么bagging可以实现的唯一方法就是将袋子里的所有树(all bagged trees)都预测为零.
- 如果我们给装在袋子里的树添加噪声则噪声会导致其中的某些树的预测值大于0, 因此这就使得bagging的平均预测偏离了0.
- 在随机森林模型中我们可以更加强烈地观察到这些现象, 因为随机森林中的基本树估计器(都是在全部特征的一个子集上训练的)都具有相对较高的方差.
- 因此, 校准曲线(calibration curve)有时候也称之为可靠性图 reliability graph, 显示了一个典型的Sigmoid函数的形状, 表明分类器更应该相信它们的“直觉”并返回更接近0或1的概率.
线性支持向量分类(LinearSVC)
- To show the performance of LinearSVC, we naively scale the output of the
decision_functioninto [0, 1] by applying min-max scaling, since SVC does not output probabilities by default. - LinearSVC shows an even more
sigmoid curvethan the RandomForestClassifier, which is typical for maximum-margin methods 最大边距方法[1] as they focus on difficult to hard samples (难分样本, classify samples that are close to the decision boundary 决策边界), 也就是支持向量(support vectors).
执行概率预测校准 plot_calibration
执行概率预测校准的两种方法:
- 基于Platt的Sigmoid模型的参数化方法
- 基于保序回归(isotonic regression) 的非参数方法 (sklearn.isotonic).
- 概率校准应该在新数据上进行而不是在训练数据上.
- 该类CalibratedClassifierCV使用交叉验证生成器, 对每个拆分, 在
训练样本上估计模型参数, 在测试样本上进行校准. - 然后对所有拆分上预测的概率进行平均.
- 已经拟合过的分类器可以通过CalibratedClassifierCV类传递参数
cv="prefit"这种方式进行校准. - 在这种情况下, 用户必须注意用于模型拟合的数据和校准的数据是不重叠的.
下图显示了有概率校准的好处.第一张图片展示了一个具有2个类别和3个数据块的数据集.中间的斑点包含每个类别的随机样本.该斑点中样本的概率应为0.5.
下图是使用没有校准的高斯朴素贝叶斯分类器, 使用sigmoid校准和非参数的isotonic校准来显示上述估计概率的数据.我们可以观察到, 非参数模型为中间样本提供最准确的概率估计, 即0.5.
以下实验是在100,000个样本(其中1,000个用于模型拟合)和20个特征的二分类的人造数据集上进行的.在这20个特征中, 只有2个特征具有信息性(informative)(这2个特征与结果预测有很大的关联), 而10个特征是冗余的.该图显示了通过逻辑回归, 线性支持向量分类器(SVC)和具有isotonic校准和sigmoid校准的线性SVC所获得的估计概率.Brier分数是一个指标, 它是校正损失(calibration loss)和细化损失(refinement loss)的结合, 通过brier_score_loss函数来进行计算, 请看下面的图例(越小越好).校正损失(Calibration loss)定义为从ROC段斜率导出的经验概率的均方偏差.细化损失(Refinement loss)可以定义为在最优代价曲线下用面积测量的期望最优损失.
我们可以观察到, 逻辑回归因为它的曲线是近似对角线所以被很好地校准了.线性SVC的校准曲线或可靠性图是一个sigmoid曲线, 代表这是一个典型的欠信任的分类器.在线性SVC中, 这是由合页损失(hinge loss)的边界属性所引起的, 它使得模型聚焦在与决策边界很近的难分样本(hard samples)上.这两种校准方法(isotonic和sigmoid)都可以解决这个问题, 并得到几乎相同的结果.下面的图片展示了在同样的数据上高斯朴素贝叶斯的校准曲线(包括无校准, isotonic校准, sigmoid校准).
我们可以观察到, 高斯朴素贝叶斯的性能非常差, 但却以不同于线性SVC的方式:线性SVC显示出一条Sigmoid校准曲线, 而高斯朴素贝叶斯的校准曲线显示出翻转的sigmoid(transposed-sigmoid)形状.这是典型的过度自信(over-confident)的分类器.在这种情况下, 分类器的过度置信度是由于冗余的特征违反了朴素贝叶斯假设的特征独立性.
用isotonic回归校正高斯朴素贝叶斯的概率可以解决这一问题, 从近似对角的校准曲线可以看出这一点.Sigmoid校准也稍微提高了brier评分, 但是不如无参数的isotonic校准方法那么强大.这是sigmoid校准的固有限制, 其参数形式被假定是sigmoid, 而不是翻转的sigmoid(transposed-sigmoid).然而, 非参数isotonic校准模型并没有作出这样强有力的假设, 只要有足够的校准数据, 就可以处理任何形状.通常, 在校准曲线为sigmoid和校准数据有限的情况下, sigmoid校准更可取, 而non-sigmoid校准曲线和大量数据可供校准的情况下, isotonic校准更可取.
如果基本估计器可以处理涉及两个以上类的分类任务, 那么CalibratedClassifierCV也可以处理.在这种情况下, 首先以一对多(one-vs-rest)的方式分别对每个类对应的二分类器进行校准.在预测未见数据的概率时, 对每类数据的校准概率分别进行预测.由于这些概率加起来不一定等于1, 所以执行后处理将其标准化(让它们加起来等于1).
下图显示了sigmoid校准是如何修改三分类问题的预测概率的.例子的是标准的2-单形(2-simplex), 其中三个角对应于三个类别.箭头指向由未标定的分类器预测的概率向量到同一分类器在预留验证集上进行sigmoid校准后预测的概率向量.颜色代表了每个点的真实类别(红色:类别1, 绿色:类别2, 蓝色:类别3).
基本分类器是具有25个基本树估计器构成的随机森林分类器.如果该分类器在所有800个训练数据点上进行了训练, 则它的预测会过度自信, 因此导致了比较大的对数损失.对一个同样的分类器(25棵树构成的随机森林), 但是这个分类器这次只在600个数据点上训练, 另外200个数据点用于method=’sigmoid’的校准, 最后得到的分类器的预测置信度被降低了, 也就是把概率向量从单形(simplex)的边上移到了中间:
经过校准以后的结果有比较低的对数损失.注意另一种可选方案是增加森林中基本估计器的数量也会带来类似的对数损失的降低.
Datasets:civil_comments, https://huggingface.co/datasets/civil_comments ↩
Chain-of-Thought Prompting Elicits Reasoning in Large Language Models: https://proceedings.neurips.cc/paper_files/paper/2022/file/9d5609613524ecf4f15af0f7b31abca4-Paper-Conference.pdf ↩
Self-Consistency Improves Chain of Thought Reasoning in Language Models: https://openreview.net/pdf?id=1PL1NIMMrw ↩
labeling benchmark, https://www.refuel.ai/blog-posts/llm-labeling-technical-report ↩
Labeling with Confidence https://www.refuel.ai/blog-posts/labeling-with-confidence ↩
https://vitalflux.com/roc-curve-auc-python-false-positive-true-positive-rate/ ↩
Language Models (Mostly) Know What They Know, https://arxiv.org/pdf/2207.05221.pdf ↩
Alexandre Gramfort, Jan Hendrik Metzen, License: BSD 3 clause. ↩
Comparison of Calibration of Classifiers¶, https://scikit-learn.org/stable/auto_examples/calibration/plot_compare_calibration.html ↩
















Comments powered by Disqus.