GCP - GCP AI
GCP AI
- GCP AI
ref:
Overview
- Data and AI have a powerful partnership;
- data is the foundation of every application integrated with artificial intelligence.
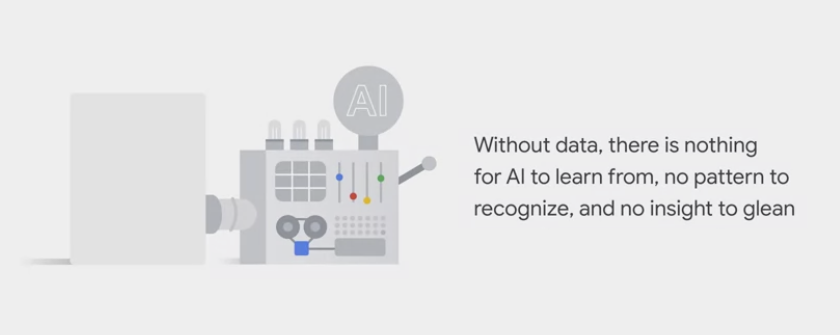
- Without
data, there is nothing for AI to learn from, no pattern to recognize, and no insight to glean. - without
artificial intelligence, large amounts of data can be unmanageable or underutilized.
- Google has nine products with over one billion users: Android, Chrome, Gmail, Google Drive, Google Maps, Google Search, the Google Play Store, YouTube, and Photos.
- That’s a lot of data being processed every day! To meet the needs of a growing user base, Google has developed the infrastructure to ingest, manage, and serve high quantities of data from these applications.
- And artificial intelligence and machine learning have been integrated into these products to make the user experience of each even more productive.
- This includes features like search in Photos, recommendations in YouTube, or Smart Compose in Gmail.
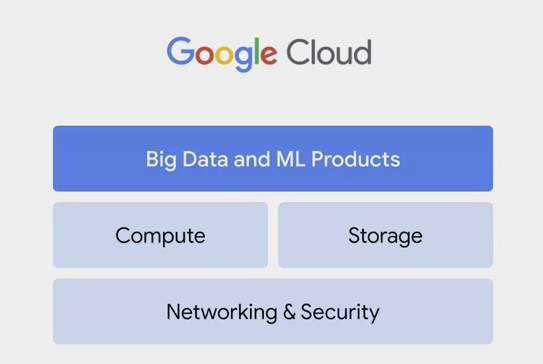
Big Data and Machine Learning on GCP
user example
- system that scale up to handle ties of high throughput and then back down again
Data Engineering for Streaming Data
Processing
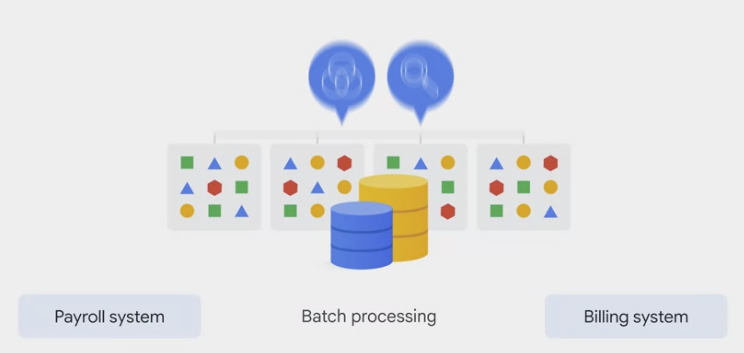
- Batch processing is when the processing and analysis happens on a set of stored data.
- An example is Payroll and billing systems that have to be processed on either a weekly or monthly basis.
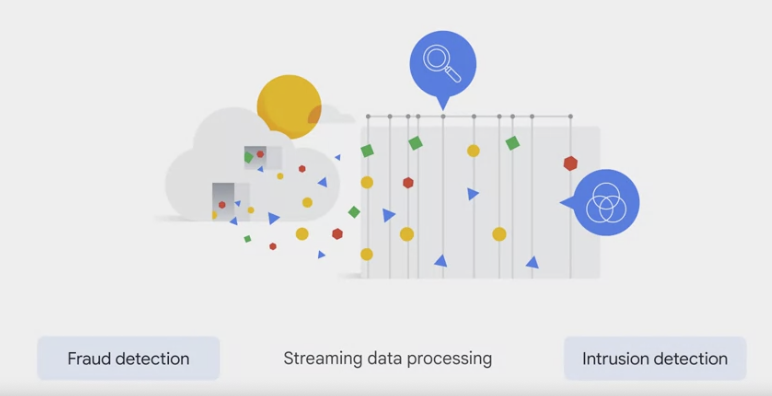
- Streaming data is a flow of data records generated by various data sources. The processing of streaming data happens as the data flows through a system. This results in the analysis and reporting of events as they happen.
- An example would be fraud detection or intrusion detection.
- Streaming data processing means that the data is analyzed in near real-time and that actions will be taken on the data as quickly as possible.
- Modern data processing has progressed from legacy batch processing of data toward working with real-time data streams.
- An example of this is streaming music and movies. No longer is it necessary to download an entire movie or album to a local device. Data streams are a key part in the world of big data.
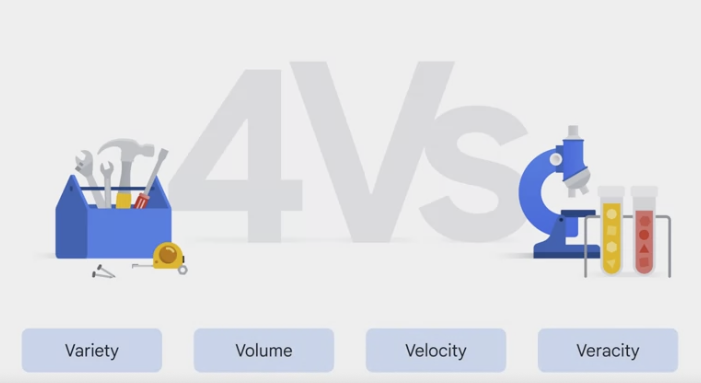
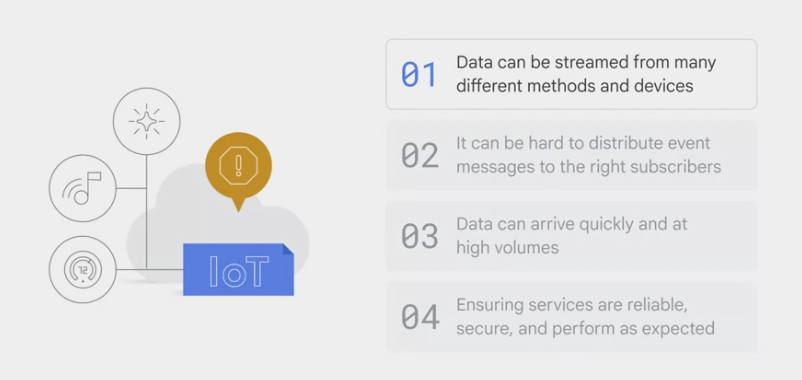
- In modern organizations, data engineers and data scientists are facing four major challenges. These are collectively known as the 4Vs. They are variety, volume, velocity, and veracity.
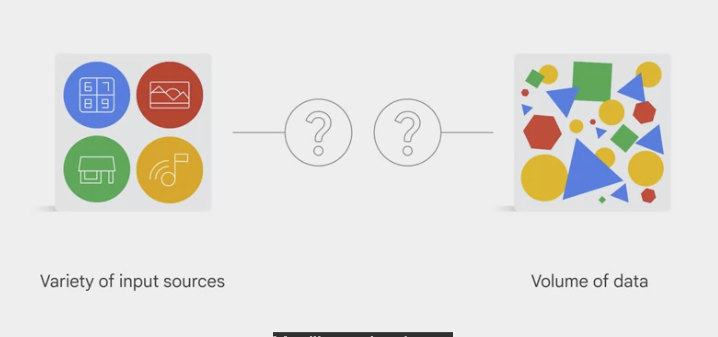
- variety: data could come in from a variety of different sources and in various formats.
- Imagine hundreds of thousands of sensors for self-driving cars on roads around the world.
- The data is
returned in various formats, such as number, image, or even audio. - How do we alert our downstream systems of new transactions in an organized way with no duplicates.
- variety: handle not only an arbitrary variety of input sources, but a
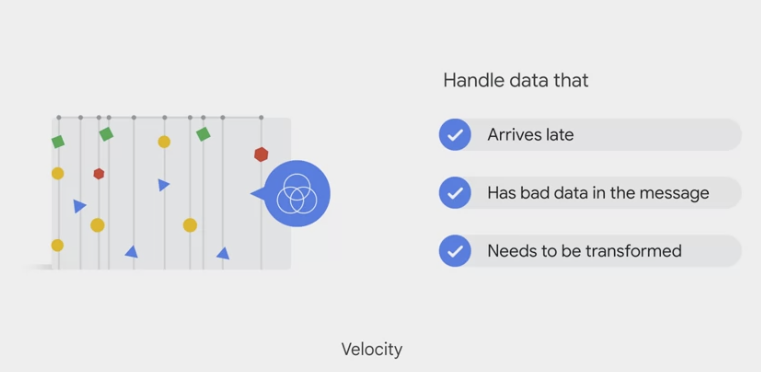
volume of data that varies from gigabytes to petabytes. - velocity 速度: Data often needs to be processed in near real time as soon as it reaches the system.
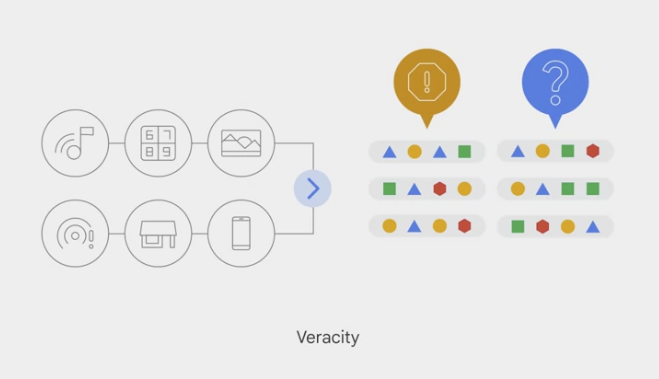
- veracity 真实: which refers to the
data quality. Because big data involves a multitude of data dimensions resulting from different data types and sources, there’s a possibility that gathered data will come with some inconsistencies and uncertainties.
user example
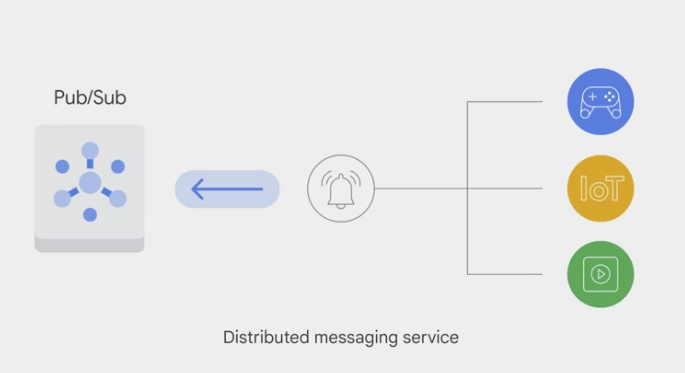
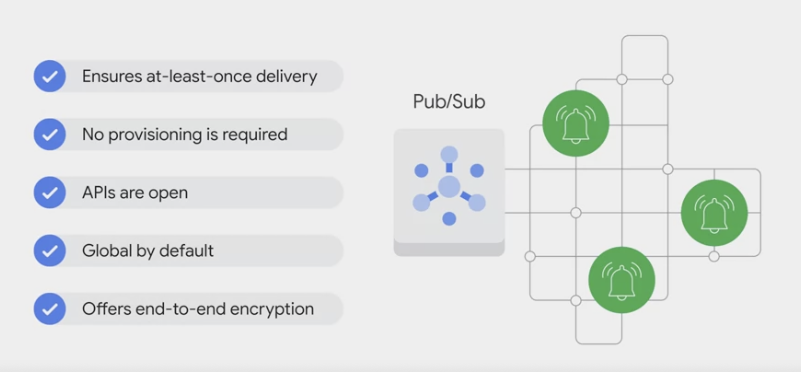
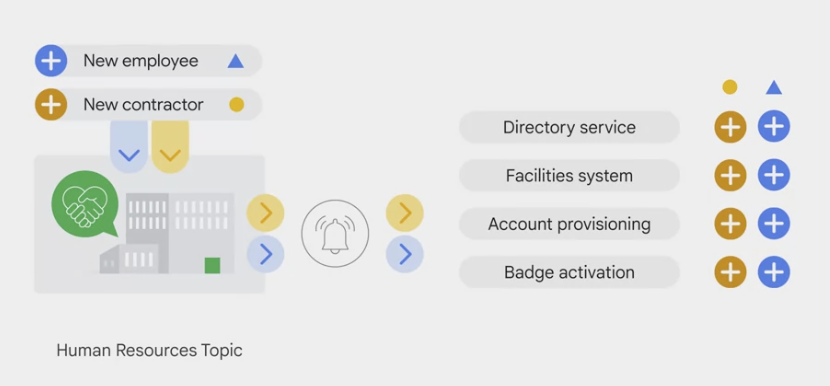
- Message-oriented architecture
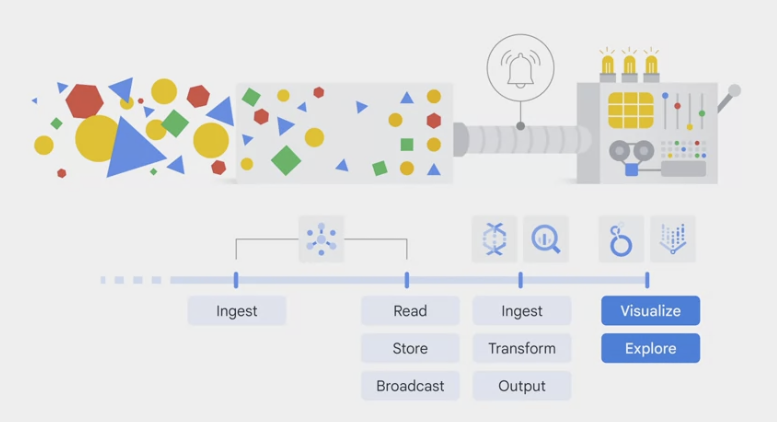
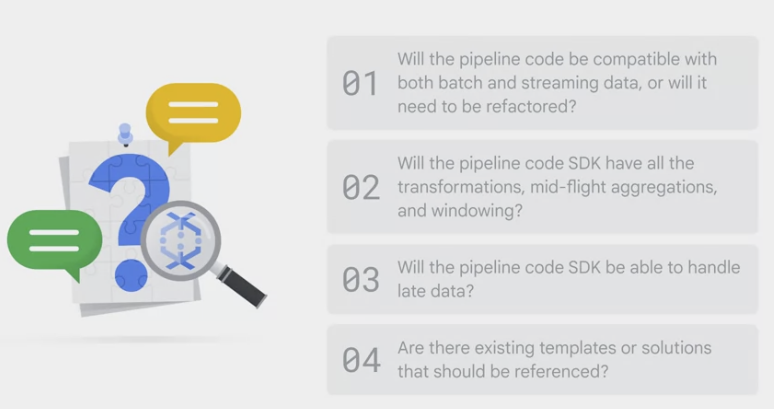
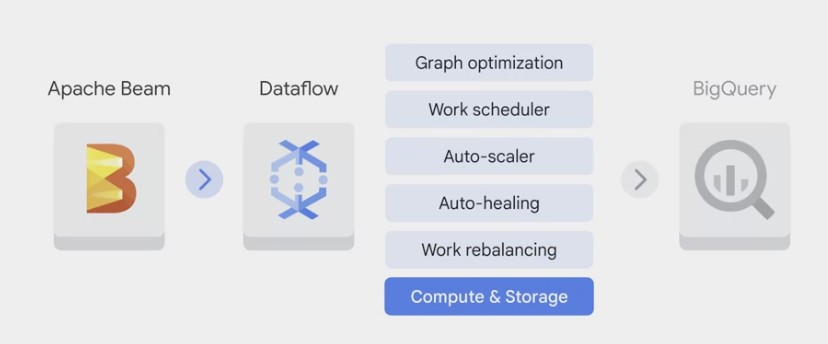
pipelines design
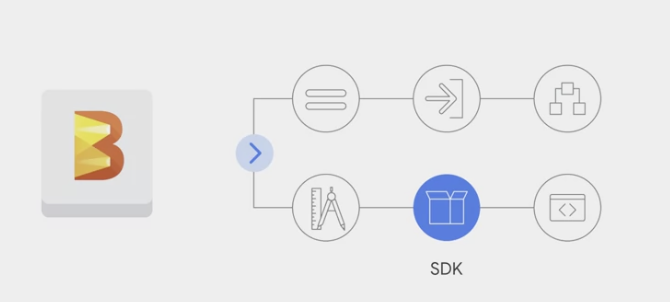
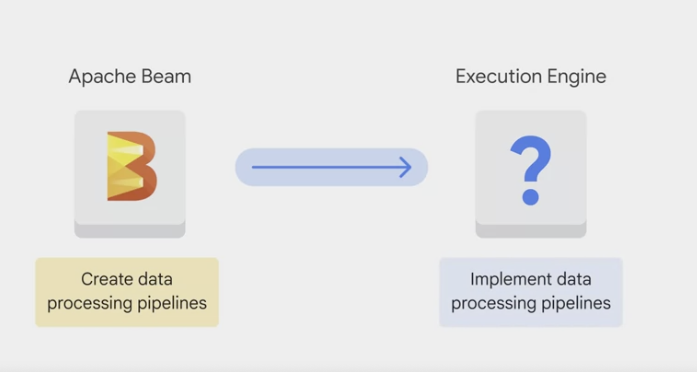
- Apache Beam
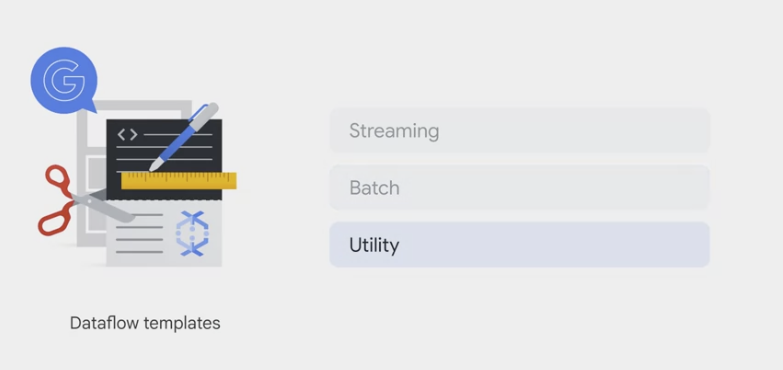
Streaming templates: for processing continuous, or real-time, data. For example:- Pub/Sub to BigQuery
- Pub/Sub to Cloud Storage
- Datastream to BigQuery
- Pub/Sub to MongoDB
Batch templates: for processing bulk data, or batch load data. For example:- BigQuery to Cloud Storage
- Bigtable to Cloud Storage
- Cloud Storage to BigQuery
- Cloud Spanner to Cloud Storage
utility templates: address activities related to bulk compression, deletion, and conversion.
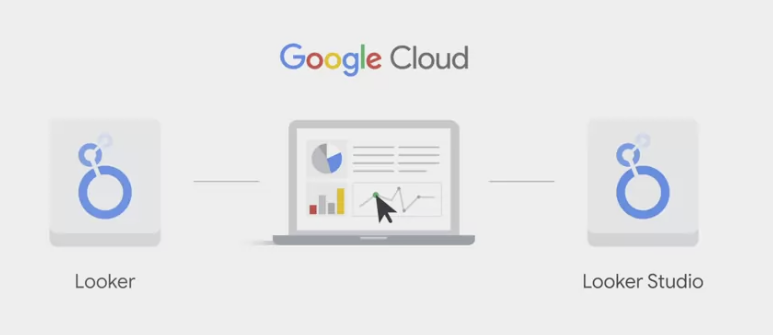
Visualization with Looker
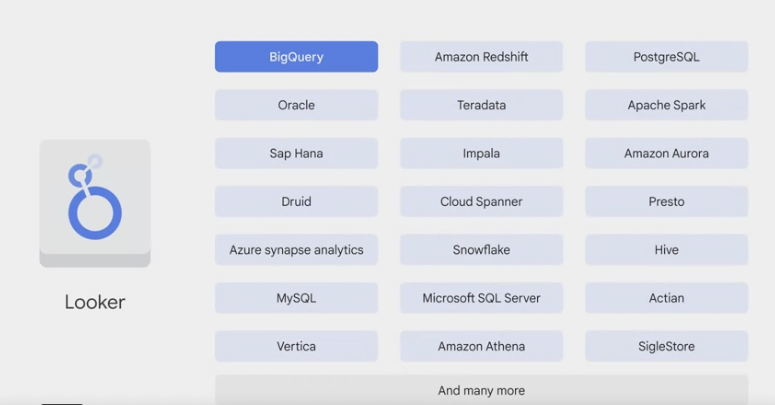
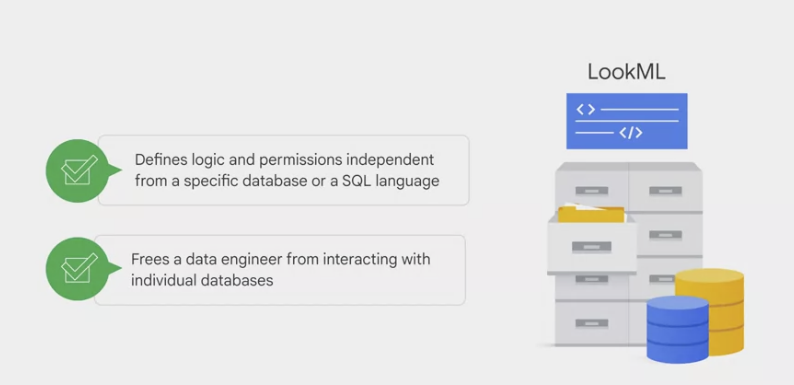
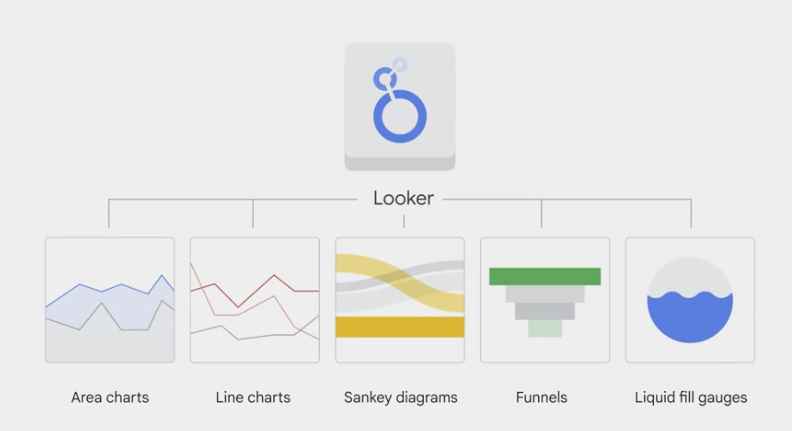
Looker
Looker output
Looker studio
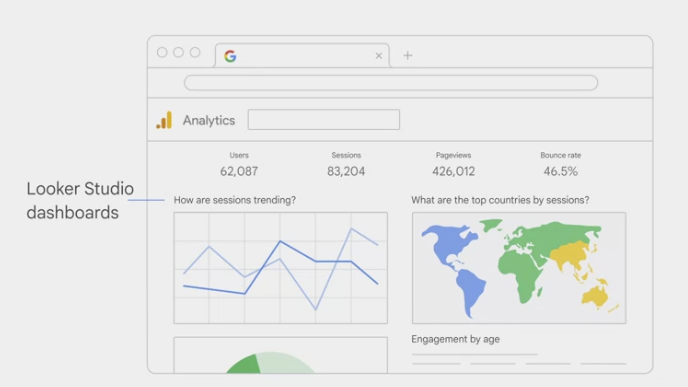
Looker Studio dashboards are widely used across many Google products and applications.
- Looker Studio integration
- Looker Studio is integrated into Google Analytics to help visualize, in this case, a summary of a marketing website.
- This dashboard visualizes the total number of visitors through a map, compares month-over-month trends, and even displays visitor distribution by age.
- Another Looker Studio integration is the GCP billing dashboard.
- Looker Studio is integrated into Google Analytics to help visualize, in this case, a summary of a marketing website.
- 3 steps needed to create a Looker Studio dashboard.
- choose a template. You can start with either a pre-built template or a blank report.
- link the dashboard to a data source. This might come from BigQuery, a local file, or a Google application like Google Sheets or Google Analytics–or a combination of any of these sources.
- explore dashboard
1
2
3
4
5
6
7
bq --location=us-east1 mk taxirides

bq --location=us-east1 mk \
    --time_partitioning_field timestamp \
    --schema ride_id:string,point_idx:integer,latitude:float,longitude:float, timestamp:timestamp,meter_reading:float,meter_increment:float,ride_status:string, passenger_count:integer \
    -t taxirides.realtime
Big Data with BigQuery
- BigQuery is a fully managed data warehouse.
- A
data warehouse: a large store, containing terabytes and petabytes of data gathered from a wide range of sources within an organization, that’s used to guide management decisions. - A
data lake: a pool of raw, unorganized, and unclassified data, which has no specified purpose. - A data warehouse on the other hand, contains structured and organized data, which can be used for advanced querying.
- A
key features of BigQuery.
storage plus analytics. It’s a place to store petabytes of data. For reference, 1 petabyte is equivalent to 11,000 movies at 4k quality. BigQuery is also a place to analyze data, with built-in features like machine learning, geospatial analysis, and business intelligence, which we will look at a bit later on.fully managed serverless solution, don’t need to worry about provisioning any resources or managing servers in the backend but only focus on using SQL queries to answer the organization’s questions in the frontend.flexible pay-as-you-go pricing modelwhere you pay for the number of bytes of data the query processes and for any permanent table storage. If you prefer to have a fixed bill every month, you can also subscribe to flat-rate pricing where you have a reserved amount of resources for use.Data in BigQuery is encrypted at rest by defaultwithout any action required from a customer. By encryption at rest, we mean encryption used to protect data that is stored on a disk, including solid-state drives, or backup media.built-in machine learning featuresto write ML models directly in BigQuery using SQL. Also, if you decide to use other professional tools—such as Vertex AI from GCP—to train the ML models, you can export datasets from BigQuery directly into Vertex AI for a seamless integration across the data-to-AI lifecycle.
Data warehouse solution architecture
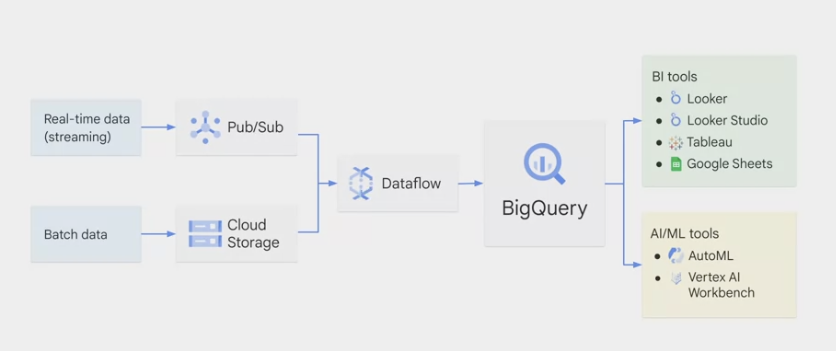
- 4 challenges of big data, in modern organizations the data can be in
any format (variety), any size (volume), any speed (velocity), and possibly inaccurate (veracity). - The input data can be either real-time or batch data.
- If it’s
streaming data, which can be either structured or unstructured, high speed, and large volume, Pub/Sub is needed to digest the data. - If it’s
batch data, it can be directly uploaded to Cloud Storage.
- If it’s
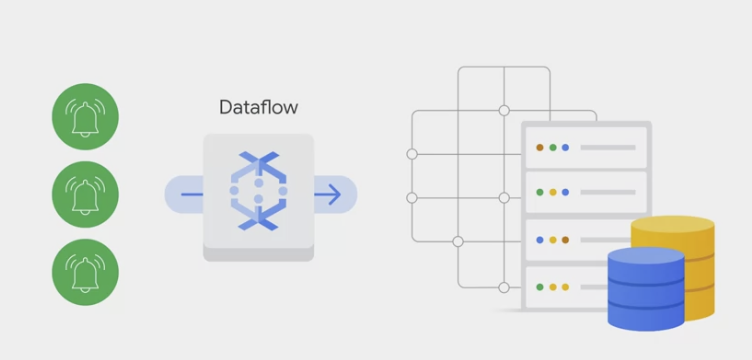
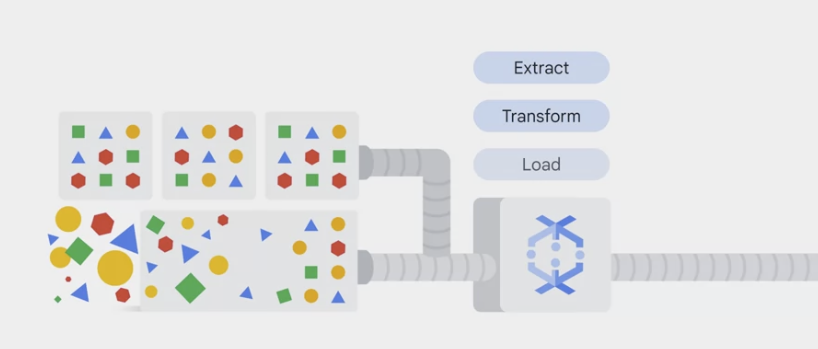
both pipelines lead to Dataflow to process the data. That’s the place we
ETL – extract, transform, and load– the data if needed.- BigQuery sits in the middle to link data processes using Dataflow and data access through analytics, AI, and ML tools.
- The job of the analytics engine of BigQuery at the end of a data pipeline is to ingest all the processed data after ETL, store and analyze it, and possibly output it for further use such as data visualization and machine learning.
- BigQuery outputs usually feed into two buckets:
business intelligence tools and AI/ML tools.- business analyst or data analyst, connect to visualization tools like
Looker, Looker Studio, Tableau, or other BI tools. If you prefer to work in spreadsheets, you can query both small or large BigQuery datasets directly from Google Sheets and even perform common operations like pivot tables. - data scientist or machine learning engineer, directly call the data from BigQuery through
AutoML or Workbench. These AI/ML tools are part of Vertex AI, Google’s unified ML platform.
- business analyst or data analyst, connect to visualization tools like
- BigQuery is like a common staging area for data analytics workloads. When the data is there, business analysts, BI developers, data scientists, and machine learning engineers can be granted access to the data for their own insights.
Storage and analytics
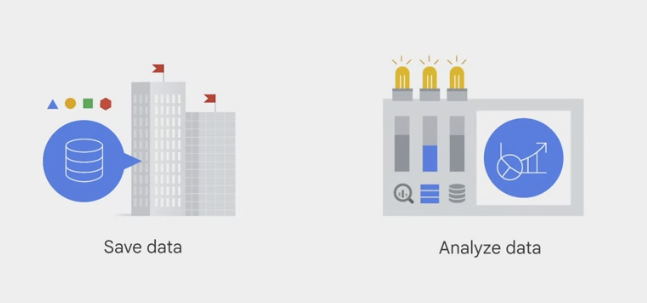
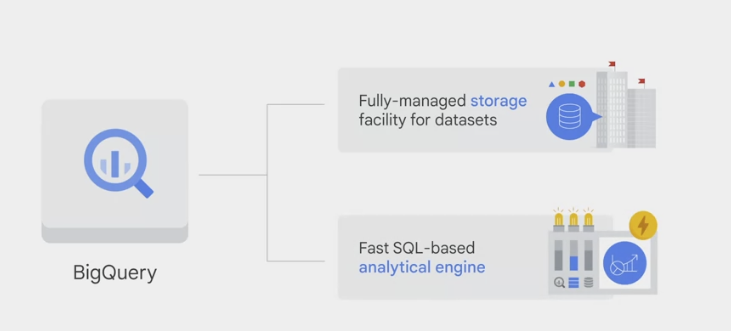
BigQuery provides two services in one.
It’s both a
fully-managed storage facility to load and store datasetsand also afast SQL-based analytical engine.The two services are connected by Google’s high-speed internal network. It’s the super-fast network that allows BigQuery to scale both storage and compute independently based on demand.
manages the storage and metadata for datasets
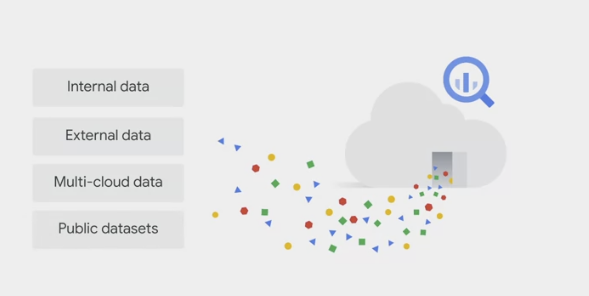
- BigQuery can
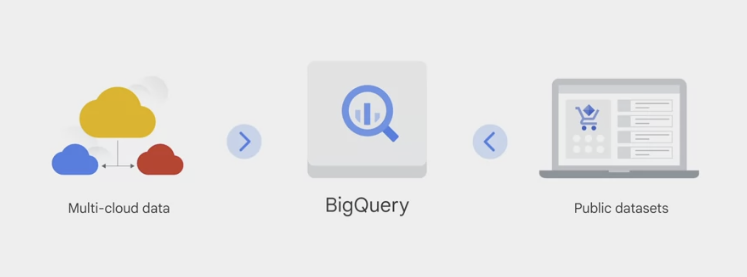
ingestdatasets from various sources including internal data (data saved directly in BigQuery), external data, multi-Cloud data, and public data-sets.
After the data is stored in BigQuery, it’s
fully managed and is automatically replicated, backed up, and set to auto-scale.BigQuery offers the option to
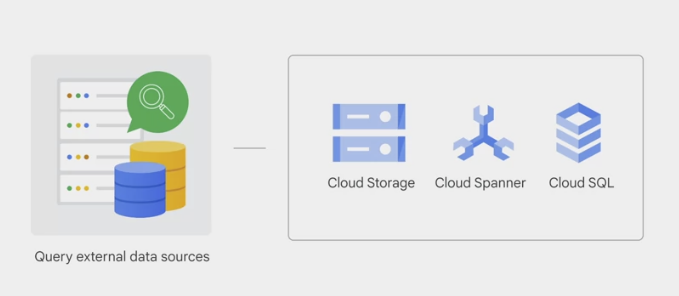
queryexternal data sources, like data stored in other GCP storage services (Cloud storage) or GCP database services (Spanner or Cloud SQL), and bypass BigQuery managed Storage.- a raw CSV file in Cloud storage or Google sheet can be used to write a query without being ingested by BigQuery first.
- inconsistency might result from saving and processing data separately, consider using DataFlow to build a streaming data pipeline into BigQuery.
- In addition to internal or native and external data sources, BigQuery can also ingest data from multi-Cloud data, which is data stored in multiple Cloud services, such as AWS or Azure, or a public data set.
- If you don’t have any data of the own, you can analyze any of the datasets available in the public data set marketplace.
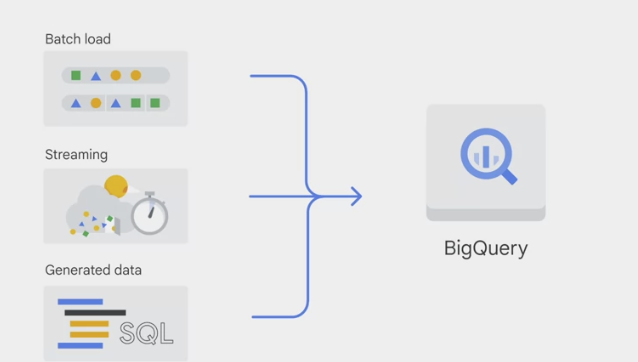
There are 3 basic patterns to load data into BigQuery.
batch load: source data is loaded into a BigQuery table in a single batch operation.- one-time operation or automated to occur on a schedule.
- A batch load operation can create a new table or open data into an existing table.
streaming: smaller batches of data are streamed continuously so that the data is available for querying in near real-time.generated data: where SQL statements are used to insert rows into an existing table or to write the results of a query to a table.
analyzing data
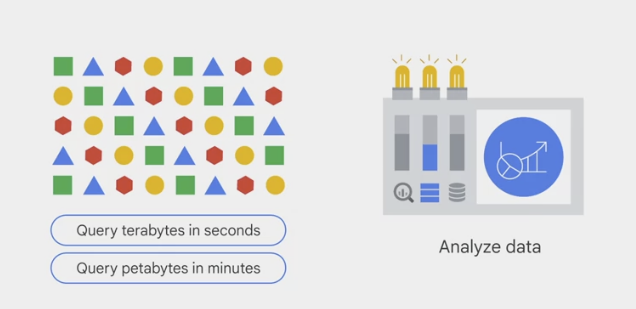
- optimized for running analytical queries over large datasets. It can perform queries on terabytes of data in seconds and petabytes in minutes.
- analyze large datasets efficiently and get insights in near real-time.
analytics features
supports ad hoc analysis using
standard SQL, the BigQuery SQL dialect, geospatial analytics using geography data types instandard SQL geography functions.supports building machine learning models using
BigQuery MLand building rich interactive business intelligence dashboards usingBigQuery BI Engine.
queries
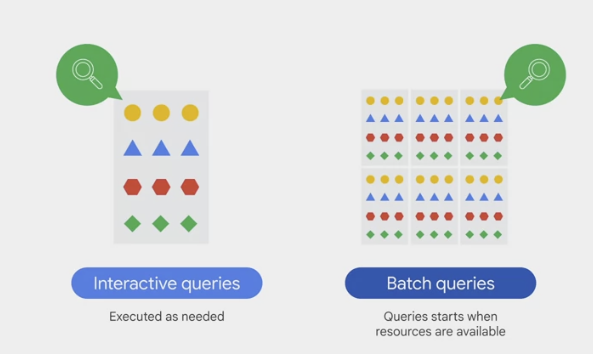
By default, it runs
interactive queries, which means that the queries are executed as needed.offers
batch querieswhere each query is queued on the behalf and the query starts when idle resources are available.
BigQuery ML
BigQuery started out solely as a data warehouse, over time it has evolved to provide features that support the data to AI lifecycle.
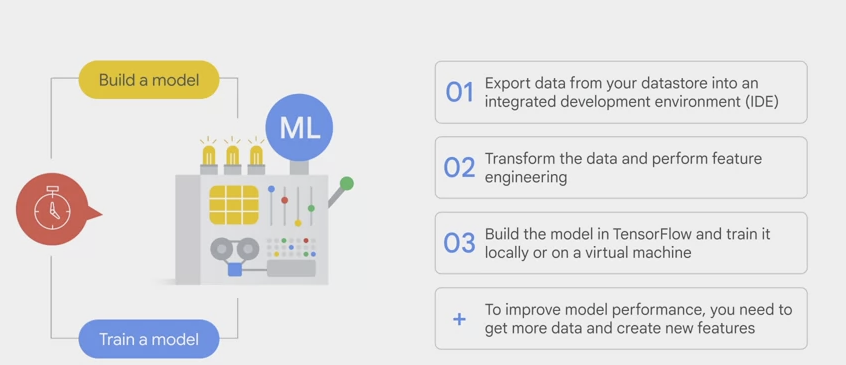
building and training them can be very time intensive.
- first
exportdata from the data store into an IDE, Integrated Development Environment, such as Jupyter Notebook or Google Colab. - And then
transformthe data and perform the feature engineering steps before feed it into a training model. - Then
buildthe model in Tensorflow or similar library and train it locally on a computer or on a virtual machine. - To improve the model performance, you also need to go back and forth to get more data and create new features. This process will need to be repeated, but it’s so time intensive that you’ll probably stop after a few iterations.
- first
- Now you can create and execute machine learning models on the structured data sets in BigQuery in just a few minutes using SQL queries.
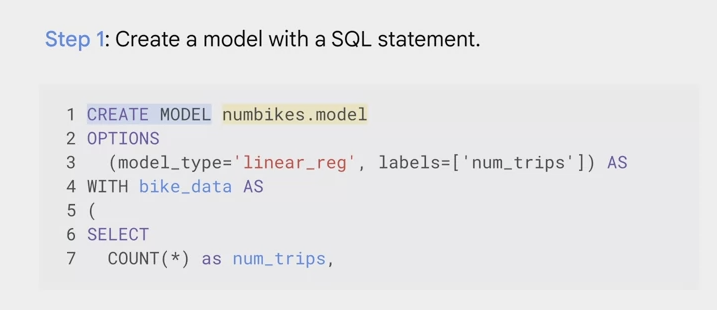
- 2 steps
- create a model with a SQL statement. Here we can use the numbikes.model data set as an example.
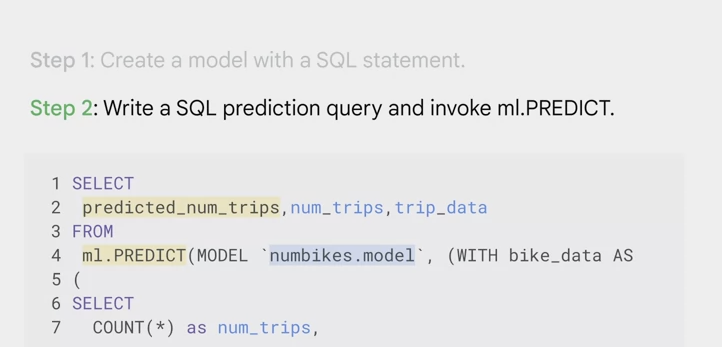
- write a SQL prediction query and invoke ml.PREDICT
you now have a model and can view the results.
- Additional steps might include activities like evaluating the model, but if you know basic SQL you can now implement ml, that’s pretty cool.
- BigQuery ML was designed to be simple, like building a model in two steps. That simplicity extends to defining the machine learning hyperparameters, which let you tune the model to achieve the best training result.
Hyperparametersare the settings apply to a model before the training starts, like a learning rate. With BigQuery ML, you can either manually control the hyperparameters. Or add it to BigQuery starting with a default hyperparameter setting and then automatic tuning.
- When using a structured dataset in BigQuery ML, you need to choose the appropriate model type.
Choosing which type of ML model depends on the business goal and the datasets.
BigQuery support
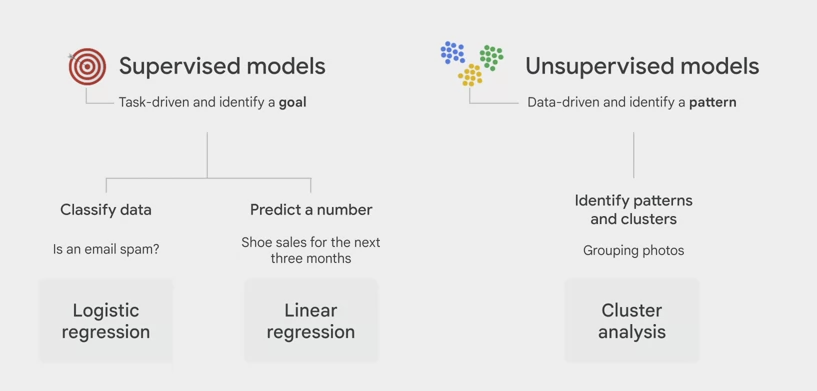
supervised and unsupervised models.- Supervised models are task driven and identify a goal.
- if the goal is to classify data like whether an email is spam, use logistic regression.
- If the goal is to predict a number like shoe sales for the next three months, use linear regression
unsupervised models are data driven and identify a pattern.
- if the goal is to identify patterns or clusters and then determine the best way to group them. Like grouping random photos of flowers into categories, you should use cluster analysis.
- decide on the best model.
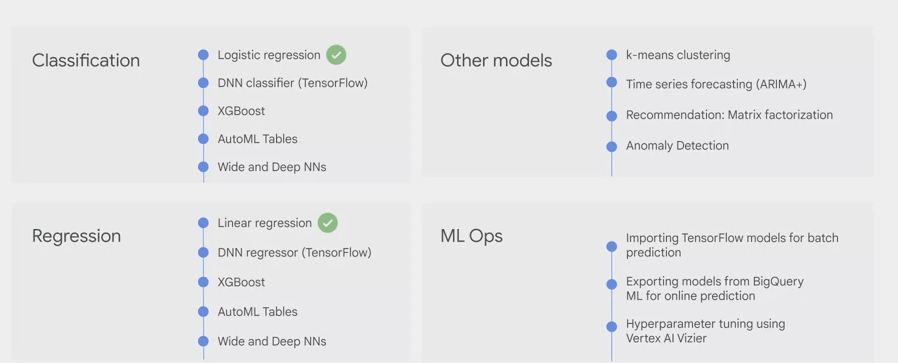
- Categories include classification and regression models. There are also other model options to choose from along with ML Ops.
- Logistic regression is an example of a classification model,
- linear regression is an example of a regression model.
- We recommend that you start with these options and use the results to benchmark.
- To compare against more complex models such as DNN, Deep Neural Networks, which may take more time in computing resources to train and deploy.
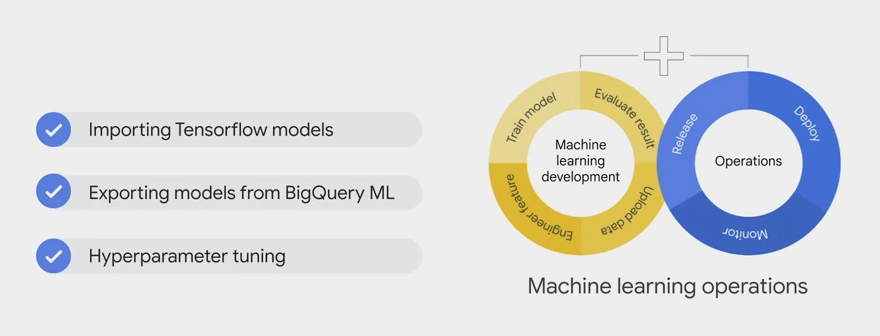
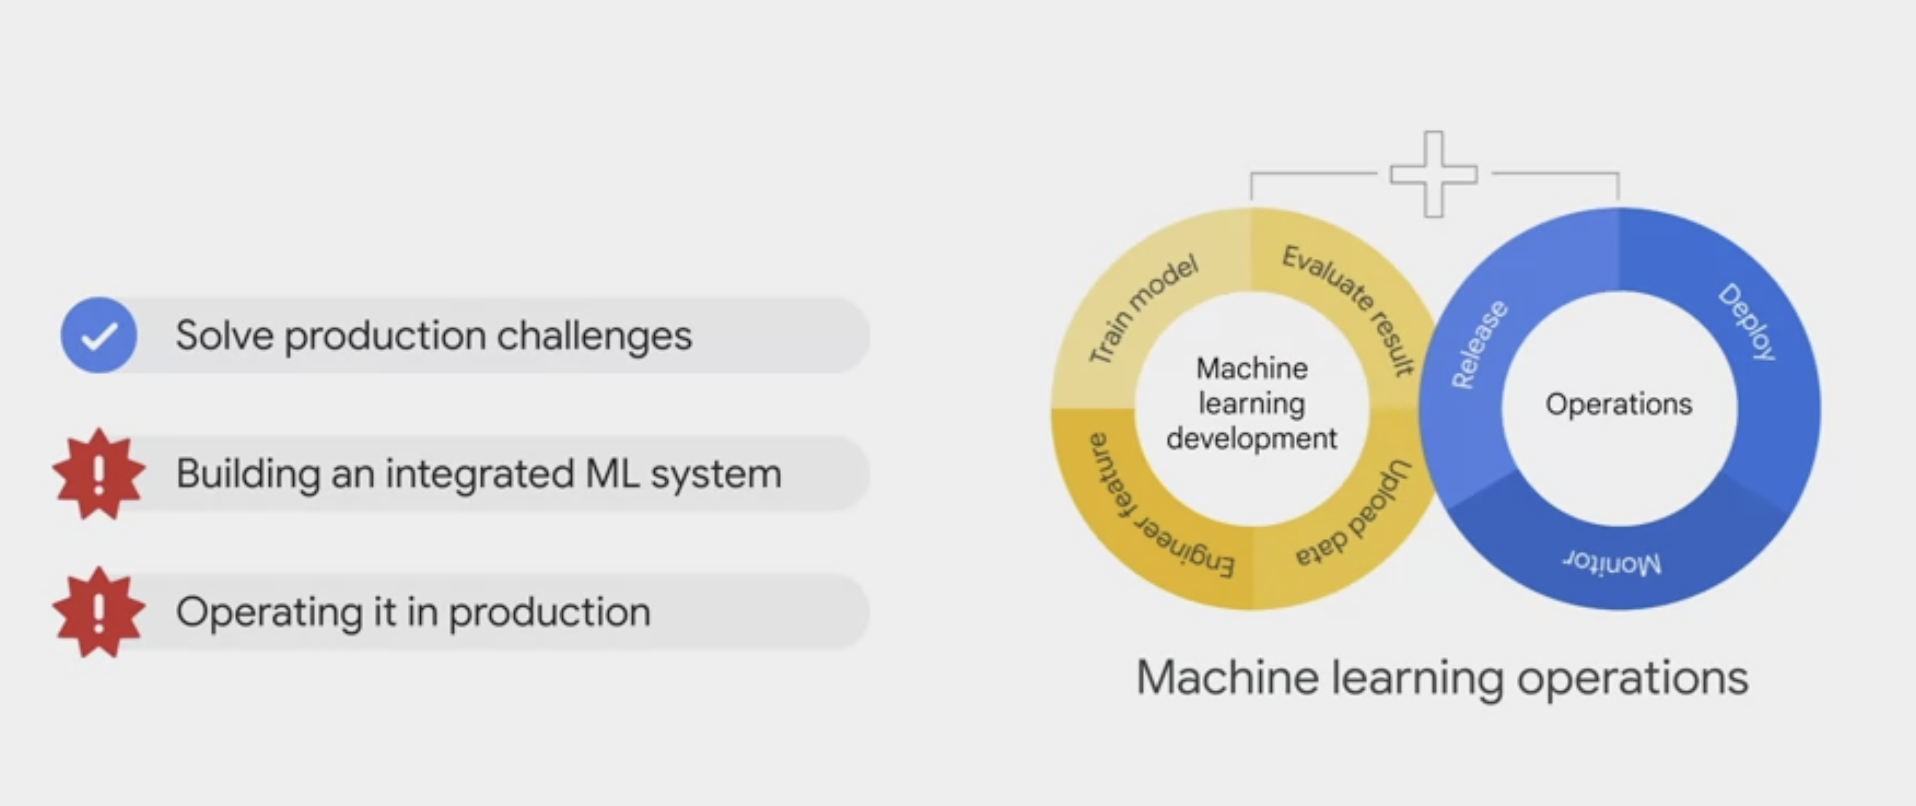
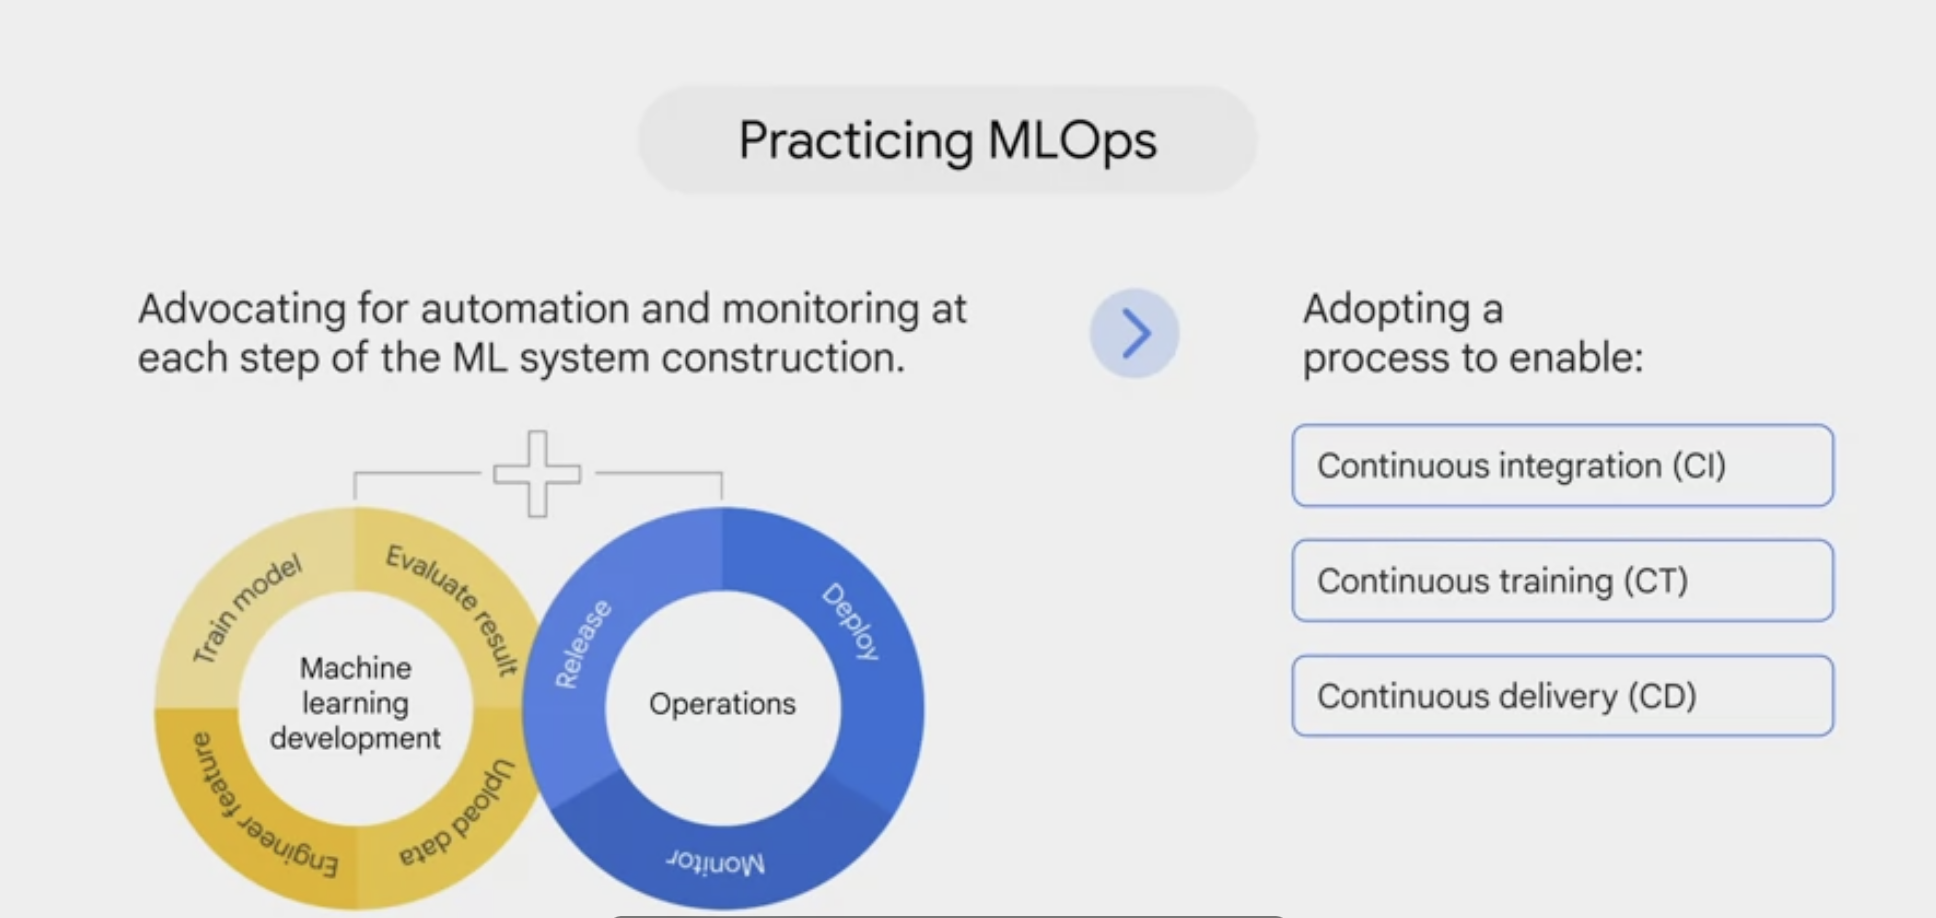
- BigQuery ML supports features to deploy, monitor and manage the ML production called ML Ops (machine learning operations).
- Ops include importing Tensorflow models for batch prediction, exporting models from BigQuery ML for online prediction. And hyperparameter tuning using Cloud AI Vizier.
Phases of ML project
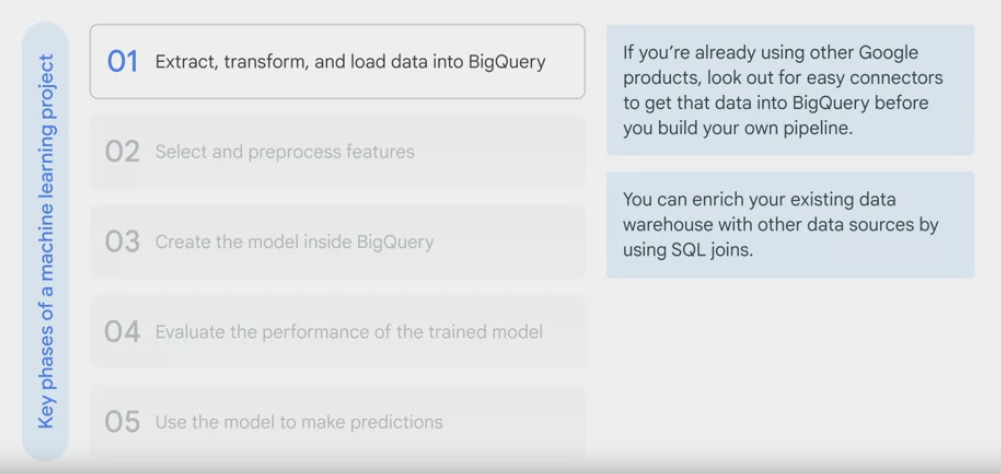
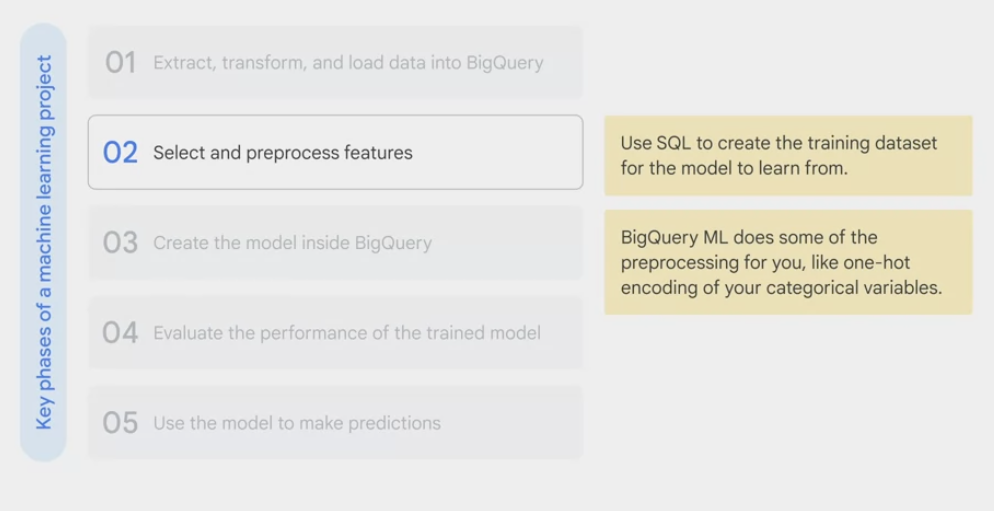
key phases of a machine learning project.
- extract, transform and load data into BigQuery if it isn’t there already.
- using Google products, look out for easy connectors to get the data into BigQuery before you build the own pipeline.
- You can enrich the existing data warehouse with other data sources by using ·.
- select and preprocessed features.
- use SQL to
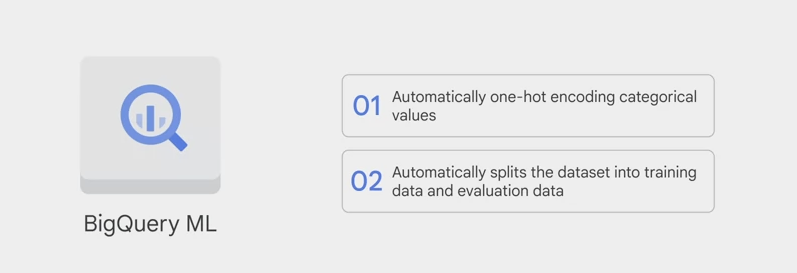
create the training dataset for the modelto learn from. - BigQuery ML does some of the preprocessing, like one-hot encoding of the categorical variables.
- One-hot encoding converts the categorical data into numeric data that is required by a training model.
- use SQL to
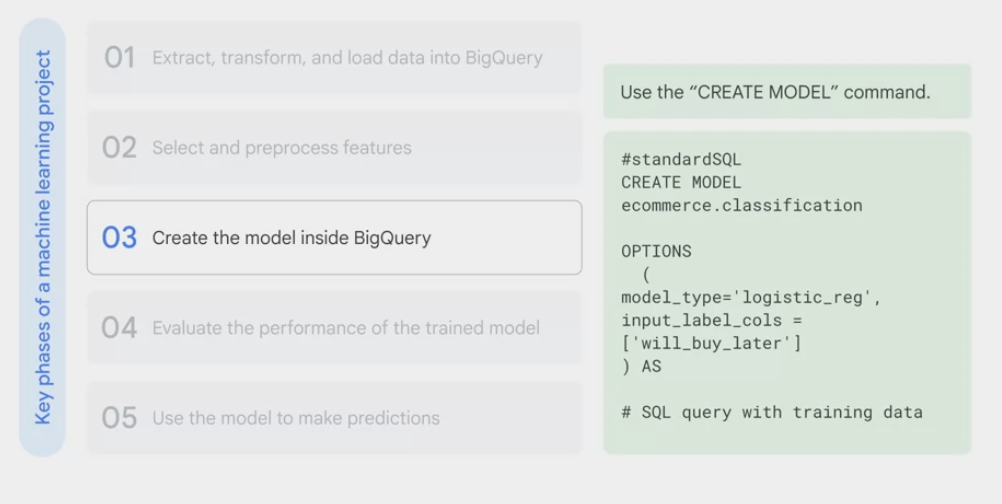
- create and train the model inside BigQuery.
- using the create model command, give it a name, specify the model type and pass it in a sequel query with the training dataset, from there you can run the query.
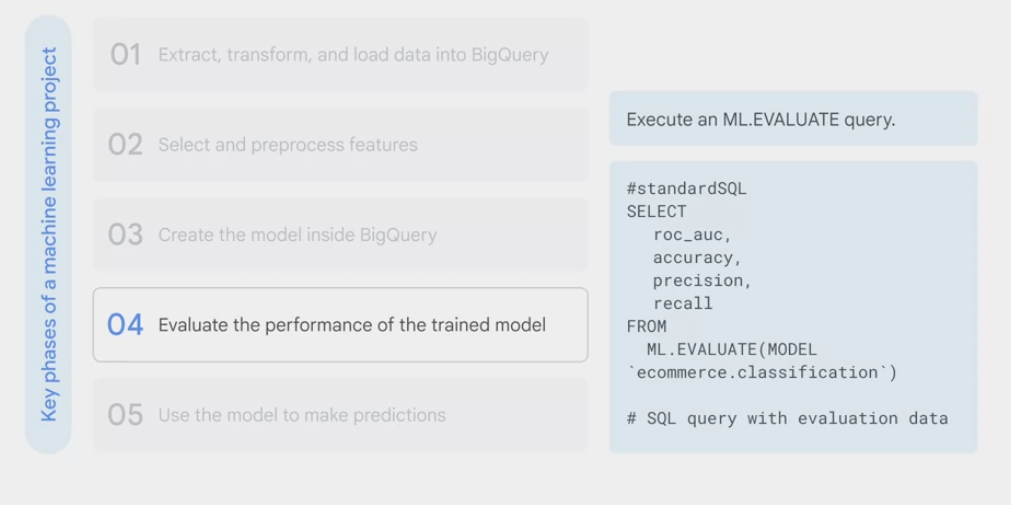
- evaluate the performance of the trained model
- execute an
ML.evaluatequery to evaluate the performance of the trained model on the evaluation dataset. - analyze lost metrics like a root mean squared error for forecasting models and area under the curve accuracy, precision and recall for classification models.
- execute an
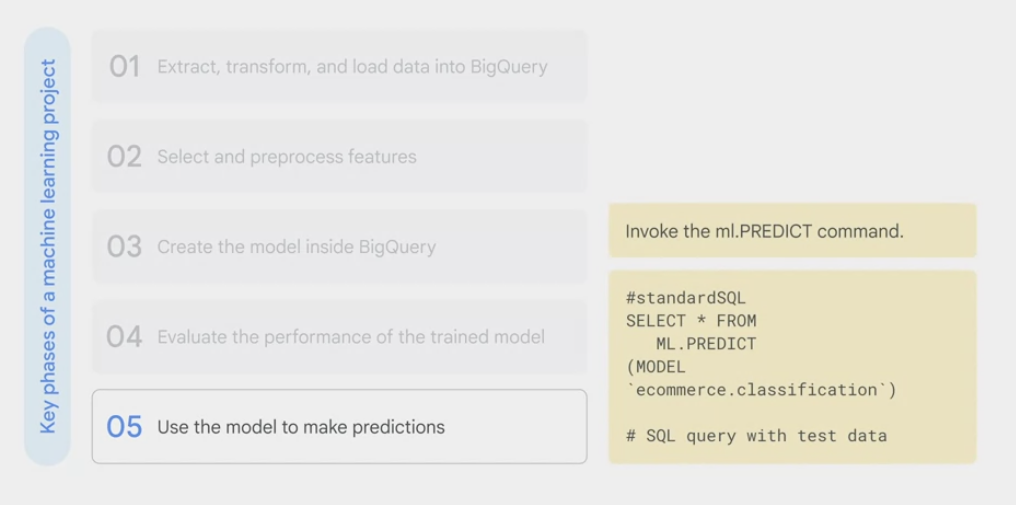
- use it to make predictions.
- invoke that
ML.predictcommand on the trained model to return with predictions and the model’s confidence in those predictions. - With the results the label field will have predicted added to the field name. This is the model’s prediction for that label.
- invoke that
BigQuery ML command
- CREATE OR REPLACE MODE
CREATE OR REPLACE MODEL 'mydataset.mymodel'
-- create a model
-- or overwrite an existing model

OPTIONS (

  model_type = 'linear_reg',
  -- only one required

  input_label_cols= 'sales',
  is_init_learn_rate= .15,
  l1_reg= 1,
  max_iterations= 5
) AS
- inspect what the model learned
- the output of ml.weights is a numerical value, each feature has a weight from -1 to 1.
- the value indicates how important the feature is for predicting the result or label
- if the number is closer to 0, the feature isn’t important for the prediction
- if the number is closer to -1/1, the feature is more important for predicting the result
SELECT
  category, weight
FROM
  UNNEST(
    (
      SELECT category.weights
      FROM ML..WEIGHT(MODEL 'bracketology.ncaa.model')
      WHERE processed_input = 'seed'
    )
  )
LIKE 'school_ncaa'
ORDER BY weight DESC
- evaluate the model’s performance
SELECT *
FROM ML.EVALUATE(MODEL 'bracketology.ncaa.model')
- make batch predictions
CREATE OR REPLACE TABLE 'bracketology.predictions' AS (

  SELECT * FROM ML.PREDICT(MODEL 'bracketology.ncaa.model'),

  -- prediction for 2018 tournament games (2017 season)
  (
    SELECT * FROM 'data.ncaa.2018_tournament_results'
  )
)
For supervised models
- label:
- need a field in the training data set titled label or specify which field or fields the labels are using as the
input label columnsin the model options
- need a field in the training data set titled label or specify which field or fields the labels are using as the
- features:
- the data columns that are part of the select statement after the create model statement
- after a model is trained use the
ml.feature_info` command to get statistics and metrics about the column for additional analysis
SELECT * FROM ML.FEATURE_INFO(MODE 'mydataset.mymodel') - model object:
- an object created in bigquery that resides in the bigquery data set you train many different models which will all be objects stored under the bigquery data set much like the tables and views
- model objects can display information for when it was last updated or how many training runs it completed
- model type
- creating a new model is as easy as writing create model choosing a type and passing in a training data set again
Forecasting- linear_reg
- Numeric value (typically an integer or floating point)
- Forecast sales figures for next year given historical sales data.
- if you’re predicting on a numeric field such as next year’s sales, consider
linear regressionfor forecasting
Classification- logistic_reg
- 0 or 1 for binary classification
- Classify an email as spam or not spam given the context.
- if it’s a discrete class like high medium low or spam or not spam, consider using
logistic regressionfor classification
CREATE OR REPLACE MODEL 'dataset.name'n OPTIONS ( model_type = 'linear_reg' ) AS <training dataset> - training process
- while the model is running and even after it’s complete you can view training progress with ml.training info as mentioned earlier
SELECT * FROM ML.TRAINING_INFO(MODE 'mydataset.mymodel') - inspect weights
- inspect weights to see what the model learned about the importance of each feature as it relates to the label you’re predicting
- the importance is indicated by the weight of each feature
SELECT * FROM ML.WEIGHT(MODE 'mydataset.mymodel', (<query>)) - evaluation
- see how well the model performed against its evaluation data set by using ml.evaluate
SELECT * FROM ML.EVALUATE(MODE 'mydataset.mymodel') - predictions
- predictions is as simple as writing ml.predict and referencing the model name and prediction data set
SELECT *
FROM ML.PREDICT(MODE 'mydataset.mymodel', (<query>))
example
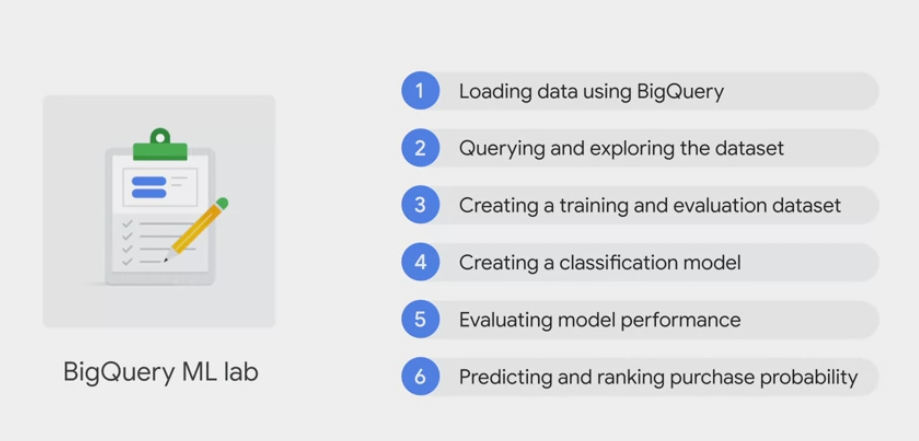
Task 1. Explore ecommerce data
1
2
3
4
5
6
7
8
9
10
11
12
13
14
15
16
17
18
19
20
21
22
23
24
25
26
27
28
29
30
31
32
33
34
35
36
37
38
39
40
41
42
43
44
45
46
47
48
49
50
51
52
# open the data-to-insights project in a new browser tab to bring this project into the BigQuery projects panel.
https://console.cloud.google.com/bigquery?p=data-to-insights&d=ecommerce&t=web_analytics&page=table


# Question: Out of the total visitors who visited our website, what % made a purchase?
#standardSQL
WITH visitors AS(
  SELECT
  COUNT(DISTINCT fullVisitorId) AS total_visitors
  FROM `data-to-insights.ecommerce.web_analytics`
),
purchasers AS(
  SELECT
  COUNT(DISTINCT fullVisitorId) AS total_purchasers
  FROM `data-to-insights.ecommerce.web_analytics`
  WHERE totals.transactions IS NOT NULL
)
SELECT
  total_visitors,
  total_purchasers,
  total_purchasers/total_visitors AS conversion_rate
FROM visitors, purchasers


# Question: What are the top 5 selling products?
SELECT
  p.v2ProductName,
  p.v2ProductCategory,
  SUM(p.productQuantity) AS units_sold,
  ROUND(SUM(p.localProductRevenue/1000000),2) AS revenue
FROM `data-to-insights.ecommerce.web_analytics`,
UNNEST(hits) AS h,
UNNEST(h.product) AS p
GROUP BY 1, 2
ORDER BY revenue DESC
LIMIT 5;


# Question: How many visitors bought on subsequent visits to the website?
# visitors who bought on a return visit (could have bought on first as well
WITH all_visitor_stats AS (
  SELECT
    fullvisitorid, # 741,721 unique visitors
    IF(COUNTIF(totals.transactions > 0 AND totals.newVisits IS NULL) > 0, 1, 0) AS will_buy_on_return_visit
  FROM `data-to-insights.ecommerce.web_analytics`
  GROUP BY fullvisitorid
)
SELECT
  COUNT(DISTINCT fullvisitorid) AS total_visitors,
  will_buy_on_return_visit
FROM all_visitor_stats
GROUP BY will_buy_on_return_visit
Task 2. Select features and create the training dataset
1
2
3
4
5
6
7
8
9
10
11
12
13
14
15
16
17
18
19
20
21
22
23
24
25
SELECT * EXCEPT(fullVisitorId)
FROM
  # features
  (
    SELECT
      fullVisitorId,
      IFNULL(totals.bounces, 0) AS bounces,
      IFNULL(totals.timeOnSite, 0) AS time_on_site
    FROM `data-to-insights.ecommerce.web_analytics`
    WHERE totals.newVisits = 1
  )
  JOIN
  (
    SELECT
      fullvisitorid,
      IF(COUNTIF(totals.transactions > 0 AND totals.newVisits IS NULL) > 0, 1, 0) AS will_buy_on_return_visit
    FROM `data-to-insights.ecommerce.web_analytics`
    GROUP BY fullvisitorid
  )
  USING (fullVisitorId)
ORDER BY time_on_site DESC
LIMIT 10;
-- The features are bounces and time_on_site.
-- The label is will_buy_on_return_visit.
-- Discussion: will_buy_on_return_visit is not known after the first visit. Again, you're predicting for a subset of users who returned to the website and purchased. Since you don't know the future at prediction time, you cannot say with certainty whether a new visitor comes back and purchases. The value of building a ML model is to get the probability of future purchase based on the data gleaned about their first session.
Task 3. Create a BigQuery dataset to store models
- Dataset ID, type ecommerce.
Task 4. Select a BigQuery ML model type and specify options
- Note: You cannot feed all of the available data to the model during training since you need to save some unseen data points for model evaluation and testing. To accomplish this, add a WHERE clause condition is being used to filter and train on only the first 9 months of session data in the 12 month dataset.
1
2
3
4
5
6
7
8
9
10
11
12
13
14
15
16
17
18
19
20
21
22
23
24
25
26
27
28
29
30
31
32
33
-- create a model and specify model options:
CREATE OR REPLACE MODEL `ecommerce.classification_model`
OPTIONS
(
  model_type='logistic_reg',
  labels = ['will_buy_on_return_visit']
)
AS
# standardSQL
SELECT * EXCEPT(fullVisitorId)
FROM
  # features
  (
    SELECT
      fullVisitorId,
      IFNULL(totals.bounces, 0) AS bounces,
      IFNULL(totals.timeOnSite, 0) AS time_on_site
    FROM `data-to-insights.ecommerce.web_analytics`
    WHERE
      totals.newVisits = 1
      AND
      date BETWEEN '20160801' AND '20170430'
  ) # train on first 9 months
  JOIN
  (
    SELECT
      fullvisitorid,
      IF(COUNTIF(totals.transactions > 0 AND totals.newVisits IS NULL) > 0, 1, 0) AS will_buy_on_return_visit
    FROM `data-to-insights.ecommerce.web_analytics`
    GROUP BY fullvisitorid
  )
  USING (fullVisitorId)
;
Task 5. Evaluate classification model performance
- In BigQuery ML,
roc_aucis simply a queryable field when evaluating the trained ML model.
1
2
3
4
5
6
7
8
9
10
11
12
13
14
15
16
17
18
19
20
21
22
23
24
25
26
27
28
29
30
31
32
33
34
SELECT
  roc_auc,
  CASE
    WHEN roc_auc > .9 THEN 'good'
    WHEN roc_auc > .8 THEN 'fair'
    WHEN roc_auc > .7 THEN 'not great'
  ELSE 'poor' END AS model_quality

-- evaluate how well the model performs by running this query using `ML.EVALUATE`
FROM ML.EVALUATE(MODEL ecommerce.classification_model,
(
  SELECT * EXCEPT(fullVisitorId)
  FROM
    # features
    (
      SELECT
        fullVisitorId,
        IFNULL(totals.bounces, 0) AS bounces,
        IFNULL(totals.timeOnSite, 0) AS time_on_site
      FROM `data-to-insights.ecommerce.web_analytics`
      WHERE
        totals.newVisits = 1
        AND date BETWEEN '20170501' AND '20170630'
    ) # eval on 2 months
    JOIN
    (
      SELECT
        fullvisitorid,
        IF(COUNTIF(totals.transactions > 0 AND totals.newVisits IS NULL) > 0, 1, 0) AS will_buy_on_return_visit
      FROM `data-to-insights.ecommerce.web_analytics`
      GROUP BY fullvisitorid)
      USING (fullVisitorId)
    )
);
Task 6. Improve model performance with feature engineering
- Add some new features and create a second machine learning model called classification_model_2:
- How far the visitor got in the checkout process on their first visit
- Where the visitor came from (traffic source: organic search, referring site etc.)
- Device category (mobile, tablet, desktop)
- Geographic information (country)
1
2
3
4
5
6
7
8
9
10
11
12
13
14
15
16
17
18
19
20
21
22
23
24
25
26
27
28
29
30
31
32
33
34
35
36
37
38
39
40
41
42
43
44
45
46
47
48
49
50
51
CREATE OR REPLACE MODEL `ecommerce.classification_model_2`
OPTIONS(
  model_type='logistic_reg',
  labels = ['will_buy_on_return_visit']
) AS
WITH all_visitor_stats AS (
  SELECT
    fullvisitorid,
    IF(COUNTIF(totals.transactions > 0 AND totals.newVisits IS NULL) > 0, 1, 0) AS will_buy_on_return_visit
  FROM `data-to-insights.ecommerce.web_analytics`
  GROUP BY fullvisitorid
)
# add in new features
SELECT * EXCEPT(unique_session_id)
FROM (
  SELECT
      CONCAT(fullvisitorid, CAST(visitId AS STRING)) AS unique_session_id,
      # labels
      will_buy_on_return_visit,
      MAX(CAST(h.eCommerceAction.action_type AS INT64)) AS latest_ecommerce_progress,
      # behavior on the site
      IFNULL(totals.bounces, 0) AS bounces,
      IFNULL(totals.timeOnSite, 0) AS time_on_site,
      totals.pageviews,
      # where the visitor came from
      trafficSource.source,
      trafficSource.medium,
      channelGrouping,
      # mobile or desktop
      device.deviceCategory,
      # geographic
      IFNULL(geoNetwork.country, "") AS country
  FROM `data-to-insights.ecommerce.web_analytics`,
     UNNEST(hits) AS h
  JOIN all_visitor_stats USING(fullvisitorid)
  WHERE 1=1
    # only predict for new visits
    AND totals.newVisits = 1
    AND date BETWEEN '20160801' AND '20170430' # train 9 months
  GROUP BY
    unique_session_id,
    will_buy_on_return_visit,
    bounces,
    time_on_site,
    totals.pageviews,
    trafficSource.source,
    trafficSource.medium,
    channelGrouping,
    device.deviceCategory,
    country
);
- Evaluate this new model to see if there is better predictive power by running the below query:
1
2
3
4
5
6
7
8
9
10
11
12
13
14
15
16
17
18
19
20
21
22
23
24
25
26
27
28
29
30
31
32
33
34
35
36
37
38
39
40
41
42
43
44
45
46
47
48
49
50
51
52
53
54
55
56
57
#standardSQL
SELECT
  roc_auc,
  CASE
    WHEN roc_auc > .9 THEN 'good'
    WHEN roc_auc > .8 THEN 'fair'
    WHEN roc_auc > .7 THEN 'not great'
  ELSE 'poor' END AS model_quality
FROM
  ML.EVALUATE(MODEL ecommerce.classification_model_2,  (
WITH all_visitor_stats AS (
SELECT
  fullvisitorid,
  IF(COUNTIF(totals.transactions > 0 AND totals.newVisits IS NULL) > 0, 1, 0) AS will_buy_on_return_visit
  FROM `data-to-insights.ecommerce.web_analytics`
  GROUP BY fullvisitorid
)
# add in new features
SELECT * EXCEPT(unique_session_id)
FROM (
  SELECT
      CONCAT(fullvisitorid, CAST(visitId AS STRING)) AS unique_session_id,
      # labels
      will_buy_on_return_visit,
      MAX(CAST(h.eCommerceAction.action_type AS INT64)) AS latest_ecommerce_progress,
      # behavior on the site
      IFNULL(totals.bounces, 0) AS bounces,
      IFNULL(totals.timeOnSite, 0) AS time_on_site,
      totals.pageviews,
      # where the visitor came from
      trafficSource.source,
      trafficSource.medium,
      channelGrouping,
      # mobile or desktop
      device.deviceCategory,
      # geographic
      IFNULL(geoNetwork.country, "") AS country
  FROM `data-to-insights.ecommerce.web_analytics`,
     UNNEST(hits) AS h
    JOIN all_visitor_stats USING(fullvisitorid)
  WHERE 1=1
    # only predict for new visits
    AND totals.newVisits = 1
    AND date BETWEEN '20170501' AND '20170630' # eval 2 months
  GROUP BY
  unique_session_id,
  will_buy_on_return_visit,
  bounces,
  time_on_site,
  totals.pageviews,
  trafficSource.source,
  trafficSource.medium,
  channelGrouping,
  device.deviceCategory,
  country
)
));
Task 7. Predict which new visitors will come back and purchase
- The predictions are made in the last 1 month (out of 12 months) of the dataset.
- the model will now output the predictions it has for those July 2017 ecommerce sessions. You can see three newly added fields:
predicted_will_buy_on_return_visit: whether the model thinks the visitor will buy later (1 = yes)predicted_will_buy_on_return_visit_probs.label: the binary classifier for yes / nopredicted_will_buy_on_return_visit_probs.prob: the confidence the model has in it’s prediction (1 = 100%)
1
2
3
4
5
6
7
8
9
10
11
12
13
14
15
16
17
18
19
20
21
22
23
24
25
26
27
28
29
30
31
32
33
34
35
36
37
38
39
40
41
42
43
44
45
46
47
48
49
50
51
SELECT
*
FROM
  ml.PREDICT(MODEL `ecommerce.classification_model_2`,
   (
WITH all_visitor_stats AS (
SELECT
  fullvisitorid,
  IF(COUNTIF(totals.transactions > 0 AND totals.newVisits IS NULL) > 0, 1, 0) AS will_buy_on_return_visit
  FROM `data-to-insights.ecommerce.web_analytics`
  GROUP BY fullvisitorid
)
  SELECT
      CONCAT(fullvisitorid, '-',CAST(visitId AS STRING)) AS unique_session_id,
      # labels
      will_buy_on_return_visit,
      MAX(CAST(h.eCommerceAction.action_type AS INT64)) AS latest_ecommerce_progress,
      # behavior on the site
      IFNULL(totals.bounces, 0) AS bounces,
      IFNULL(totals.timeOnSite, 0) AS time_on_site,
      totals.pageviews,
      # where the visitor came from
      trafficSource.source,
      trafficSource.medium,
      channelGrouping,
      # mobile or desktop
      device.deviceCategory,
      # geographic
      IFNULL(geoNetwork.country, "") AS country
  FROM `data-to-insights.ecommerce.web_analytics`,
     UNNEST(hits) AS h
    JOIN all_visitor_stats USING(fullvisitorid)
  WHERE
    # only predict for new visits
    totals.newVisits = 1
    AND date BETWEEN '20170701' AND '20170801' # test 1 month
  GROUP BY
  unique_session_id,
  will_buy_on_return_visit,
  bounces,
  time_on_site,
  totals.pageviews,
  trafficSource.source,
  trafficSource.medium,
  channelGrouping,
  device.deviceCategory,
  country
)
)
ORDER BY
  predicted_will_buy_on_return_visit DESC;
to create a XGBoost Classifier:
1
2
3
4
5
6
7
8
9
10
11
12
13
14
15
16
17
18
19
20
21
22
23
24
25
26
27
28
29
30
31
32
33
34
35
36
37
38
39
40
41
42
43
44
45
46
47
48
49
CREATE OR REPLACE MODEL `ecommerce.classification_model_3`
        OPTIONS
          (model_type='BOOSTED_TREE_CLASSIFIER' , l2_reg = 0.1, num_parallel_tree = 8, max_tree_depth = 10,
              labels = ['will_buy_on_return_visit']) AS
        WITH all_visitor_stats AS (
        SELECT
          fullvisitorid,
          IF(COUNTIF(totals.transactions > 0 AND totals.newVisits IS NULL) > 0, 1, 0) AS will_buy_on_return_visit
          FROM `data-to-insights.ecommerce.web_analytics`
          GROUP BY fullvisitorid
        )
        # add in new features
        SELECT * EXCEPT(unique_session_id) FROM (
          SELECT
              CONCAT(fullvisitorid, CAST(visitId AS STRING)) AS unique_session_id,
              # labels
              will_buy_on_return_visit,
              MAX(CAST(h.eCommerceAction.action_type AS INT64)) AS latest_ecommerce_progress,
              # behavior on the site
              IFNULL(totals.bounces, 0) AS bounces,
              IFNULL(totals.timeOnSite, 0) AS time_on_site,
              totals.pageviews,
              # where the visitor came from
              trafficSource.source,
              trafficSource.medium,
              channelGrouping,
              # mobile or desktop
              device.deviceCategory,
              # geographic
              IFNULL(geoNetwork.country, "") AS country
          FROM `data-to-insights.ecommerce.web_analytics`,
             UNNEST(hits) AS h
            JOIN all_visitor_stats USING(fullvisitorid)
          WHERE 1=1
            # only predict for new visits
            AND totals.newVisits = 1
            AND date BETWEEN '20160801' AND '20170430' # train 9 months
          GROUP BY
          unique_session_id,
          will_buy_on_return_visit,
          bounces,
          time_on_site,
          totals.pageviews,
          trafficSource.source,
          trafficSource.medium,
          channelGrouping,
          device.deviceCategory,
          country
        );
now evaluate our model and see how we did:
1
2
3
4
5
6
7
8
9
10
11
12
13
14
15
16
17
18
19
20
21
22
23
24
25
26
27
28
29
30
31
32
33
34
35
36
37
38
39
40
41
42
43
44
45
46
47
48
49
50
51
52
53
54
55
56
#standardSQL
SELECT
  roc_auc,
  CASE
    WHEN roc_auc > .9 THEN 'good'
    WHEN roc_auc > .8 THEN 'fair'
    WHEN roc_auc > .7 THEN 'not great'
  ELSE 'poor' END AS model_quality
FROM
  ML.EVALUATE(MODEL ecommerce.classification_model_3,  (
WITH all_visitor_stats AS (
SELECT
  fullvisitorid,
  IF(COUNTIF(totals.transactions > 0 AND totals.newVisits IS NULL) > 0, 1, 0) AS will_buy_on_return_visit
  FROM `data-to-insights.ecommerce.web_analytics`
  GROUP BY fullvisitorid
)
# add in new features
SELECT * EXCEPT(unique_session_id) FROM (
  SELECT
      CONCAT(fullvisitorid, CAST(visitId AS STRING)) AS unique_session_id,
      # labels
      will_buy_on_return_visit,
      MAX(CAST(h.eCommerceAction.action_type AS INT64)) AS latest_ecommerce_progress,
      # behavior on the site
      IFNULL(totals.bounces, 0) AS bounces,
      IFNULL(totals.timeOnSite, 0) AS time_on_site,
      totals.pageviews,
      # where the visitor came from
      trafficSource.source,
      trafficSource.medium,
      channelGrouping,
      # mobile or desktop
      device.deviceCategory,
      # geographic
      IFNULL(geoNetwork.country, "") AS country
  FROM `data-to-insights.ecommerce.web_analytics`,
     UNNEST(hits) AS h
    JOIN all_visitor_stats USING(fullvisitorid)
  WHERE 1=1
    # only predict for new visits
    AND totals.newVisits = 1
    AND date BETWEEN '20170501' AND '20170630' # eval 2 months
  GROUP BY
  unique_session_id,
  will_buy_on_return_visit,
  bounces,
  time_on_site,
  totals.pageviews,
  trafficSource.source,
  trafficSource.medium,
  channelGrouping,
  device.deviceCategory,
  country
)
));
finish up by generating predictions with our improved model and see how they compare to those we generated before. By using a Boosted tree classifier model, you can observe a slight improvement of 0.2 in our ROC AUC compared to the previous model. The query below will predict which new visitors will come back and make a purchase:
1
2
3
4
5
6
7
8
9
10
11
12
13
14
15
16
17
18
19
20
21
22
23
24
25
26
27
28
29
30
31
32
33
34
35
36
37
38
39
40
41
42
43
44
45
46
47
48
49
50
51
SELECT
*
FROM
  ml.PREDICT(MODEL `ecommerce.classification_model_3`,
   (
WITH all_visitor_stats AS (
SELECT
  fullvisitorid,
  IF(COUNTIF(totals.transactions > 0 AND totals.newVisits IS NULL) > 0, 1, 0) AS will_buy_on_return_visit
  FROM `data-to-insights.ecommerce.web_analytics`
  GROUP BY fullvisitorid
)
  SELECT
      CONCAT(fullvisitorid, '-',CAST(visitId AS STRING)) AS unique_session_id,
      # labels
      will_buy_on_return_visit,
      MAX(CAST(h.eCommerceAction.action_type AS INT64)) AS latest_ecommerce_progress,
      # behavior on the site
      IFNULL(totals.bounces, 0) AS bounces,
      IFNULL(totals.timeOnSite, 0) AS time_on_site,
      totals.pageviews,
      # where the visitor came from
      trafficSource.source,
      trafficSource.medium,
      channelGrouping,
      # mobile or desktop
      device.deviceCategory,
      # geographic
      IFNULL(geoNetwork.country, "") AS country
  FROM `data-to-insights.ecommerce.web_analytics`,
     UNNEST(hits) AS h
    JOIN all_visitor_stats USING(fullvisitorid)
  WHERE
    # only predict for new visits
    totals.newVisits = 1
    AND date BETWEEN '20170701' AND '20170801' # test 1 month
  GROUP BY
  unique_session_id,
  will_buy_on_return_visit,
  bounces,
  time_on_site,
  totals.pageviews,
  trafficSource.source,
  trafficSource.medium,
  channelGrouping,
  device.deviceCategory,
  country
)
)
ORDER BY
  predicted_will_buy_on_return_visit DESC;
Machine Learning on GCP
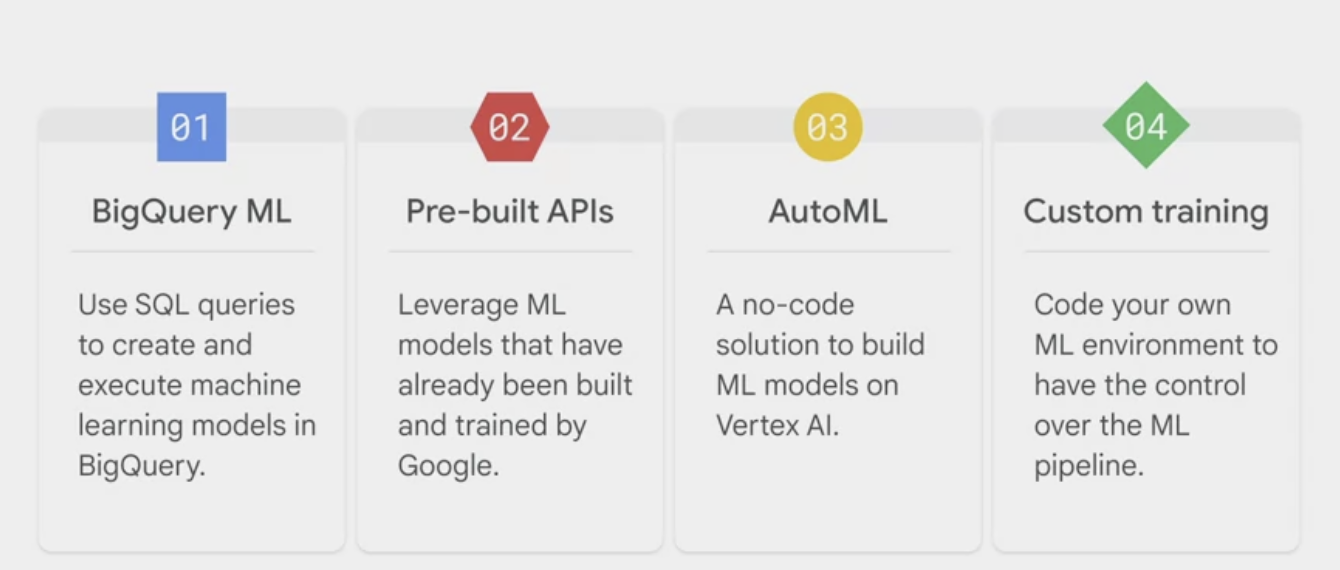
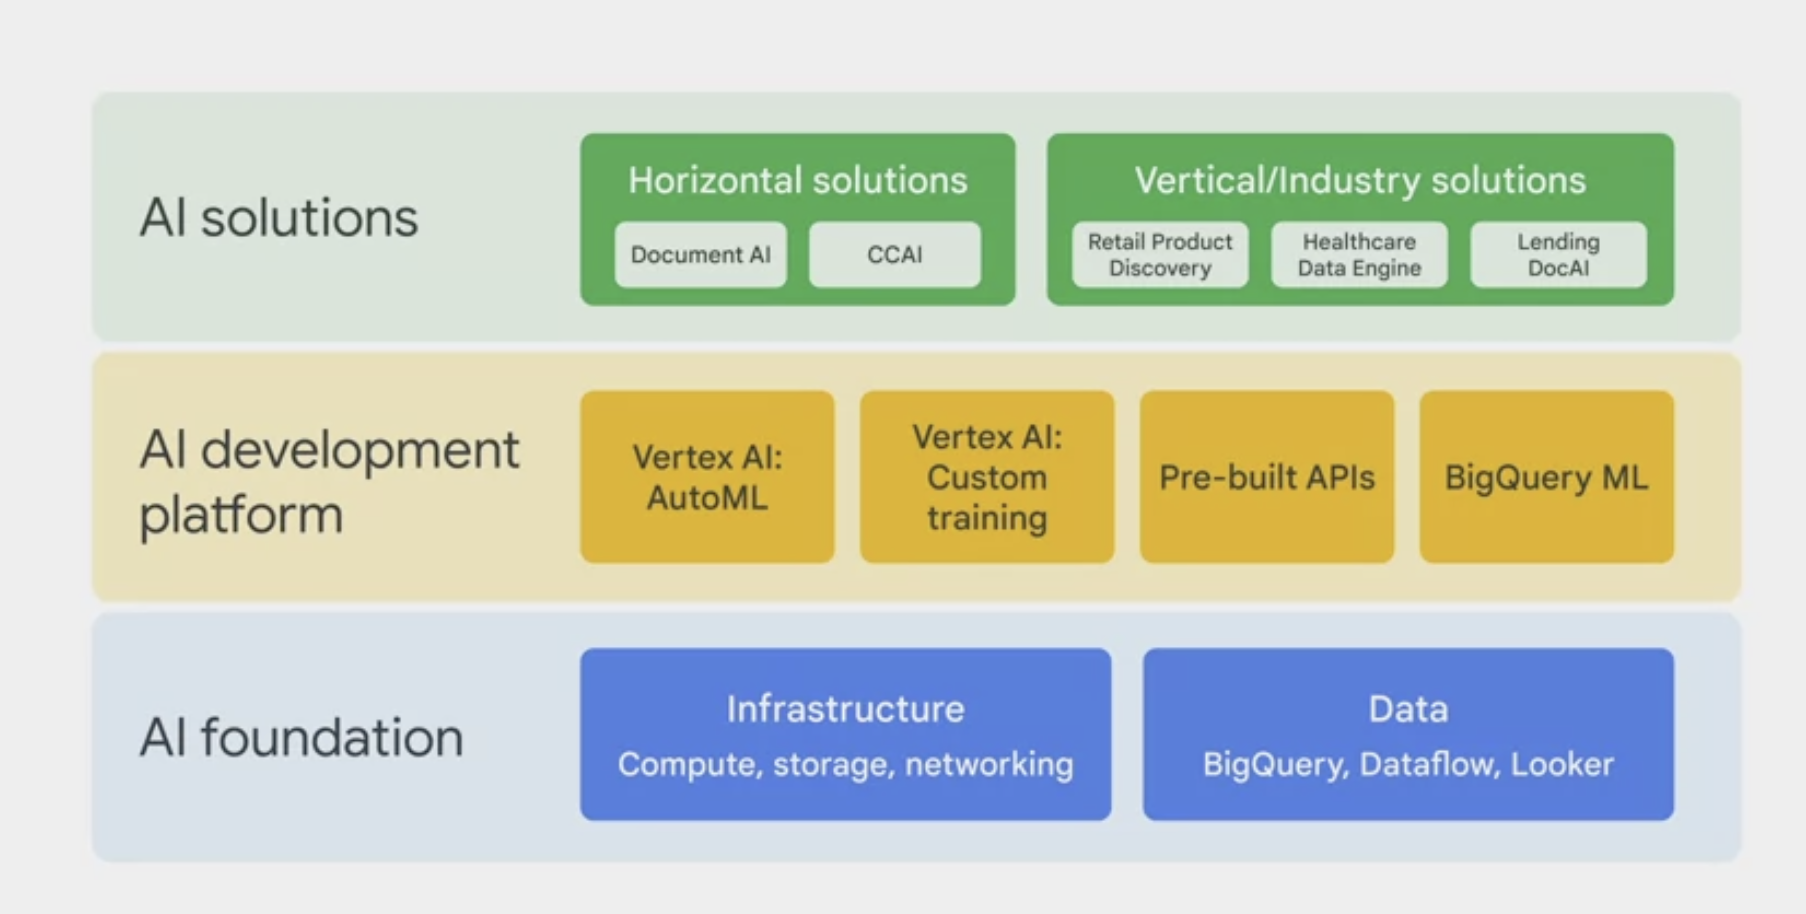
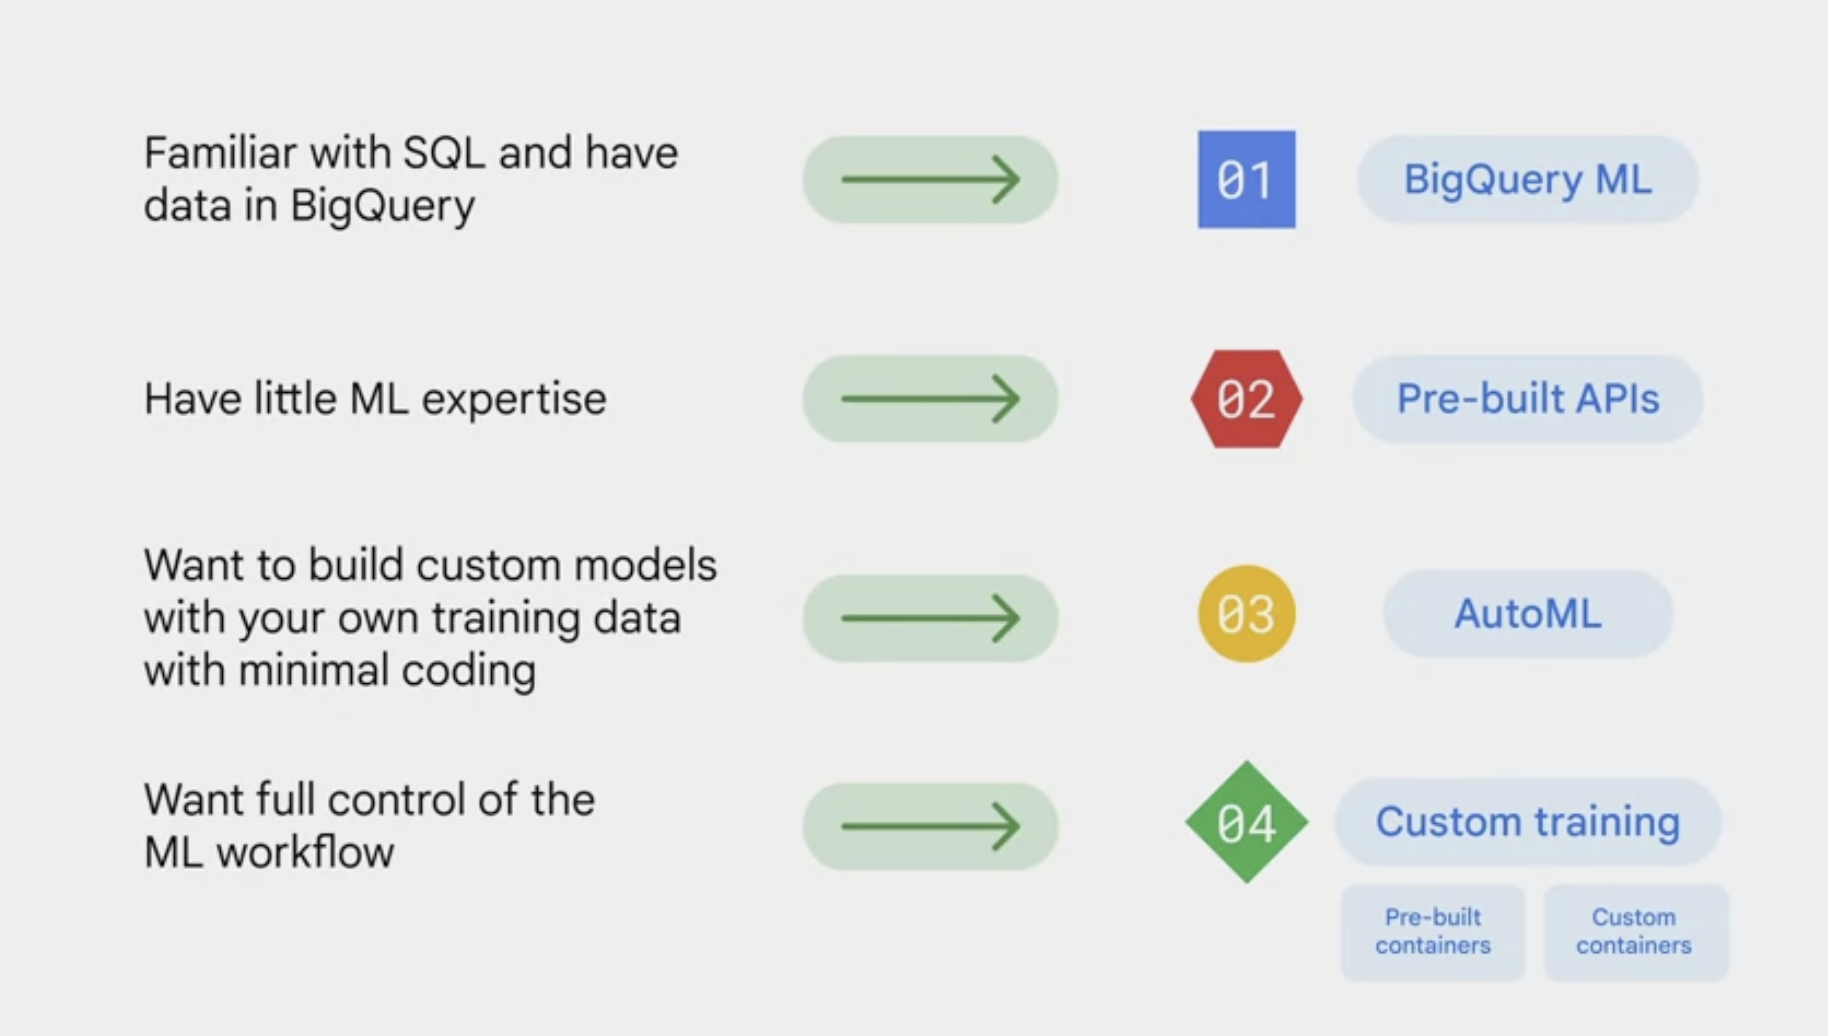
GCP offers 4 options for building machine learning models.
- BigQuery ML.
- a tool for using SQL queries to create and execute machine learning models in BigQuery.
- when have the data in BigQuery and the problems fit the predefined ML models, this could be the choice.
- Pre-built APIs
- leverage machine-learning models that have already been built and trained by Google
- don’t have to build the own machine learning models if you don’t have enough training data or sufficient machine learning expertise
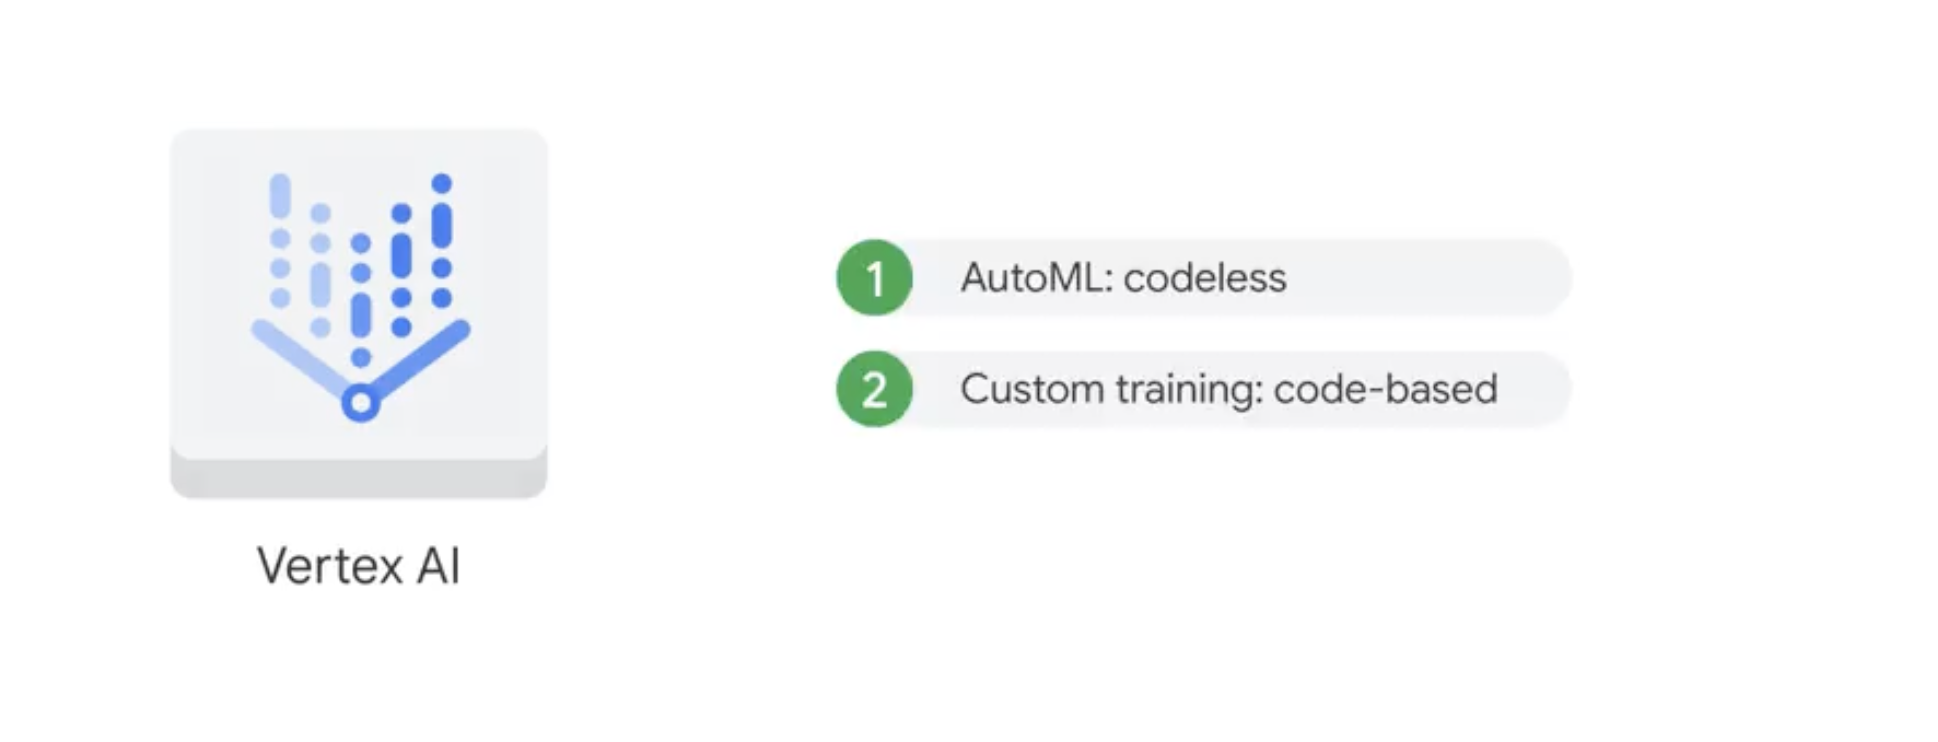
- AutoML
- a no-code solution
- build the own machine learning models on Vertex AI through a point-and-click interface.
- Vertex AI custom training
- code the very own machine learning environment, the training and the deployment
- gives flexibility and provides full control over the ML pipeline.
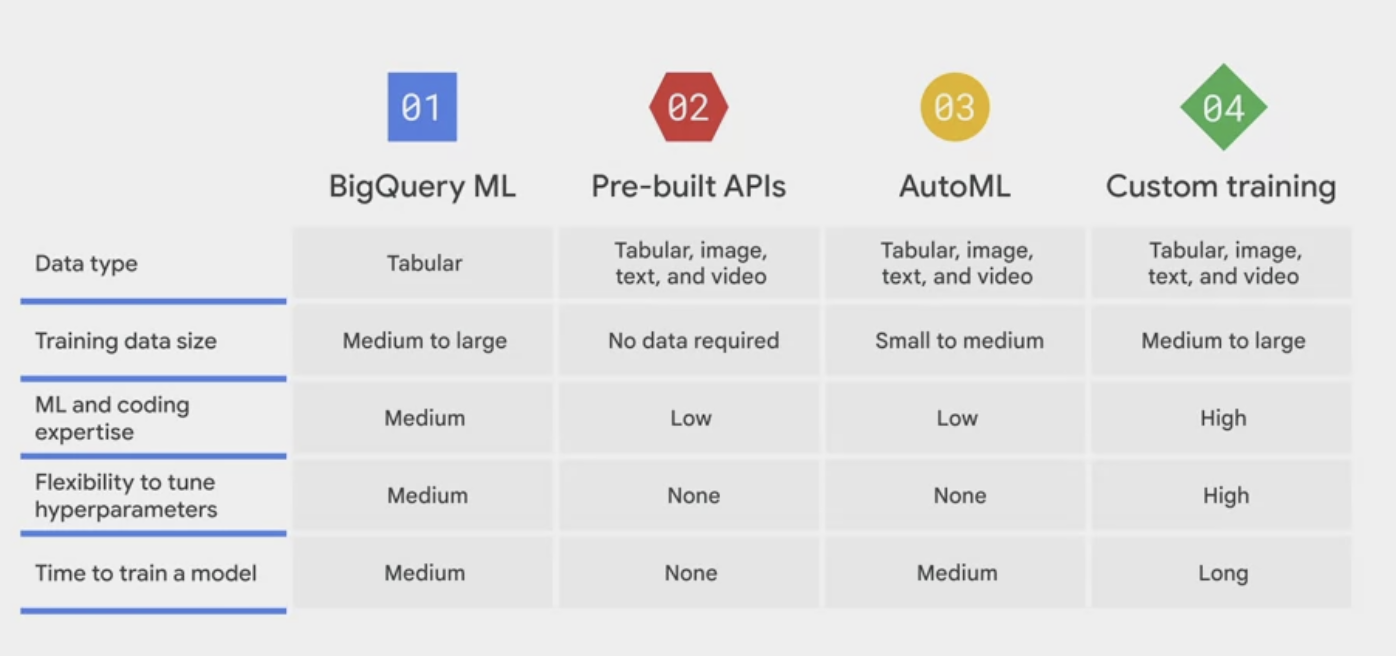
- Datatype.
- BigQuery ML only supports tabular data,
- while the other three support tabular image, text, and video data.
- Training data size.
- Pre-built APIs don’t require any training data,
- while BigQuery ML, and custom training require a large amount of data.
- Machine learning and coding expertise,
- pre-built APIs and AutoML are user-friendly with low requirements
- while custom training has the highest requirement and BigQuery ML requires you to understand SQL.
- Flexibility to tune the hyperparameters.
- you can’t tune the hyperparameters with pre-built APIs or AutoML.
- you can experiment with hyperparameters using BigQuery ML and custom training.
- Time to train the model.
- Pre-built APIs require no time to train a model because they directly use pre-built models from Google.
- The time to train a model for the other three options depends on the specific project. Normally, custom training takes the longest time because it builds the ML model from scratch, unlike AutoML and BigQuery ML.
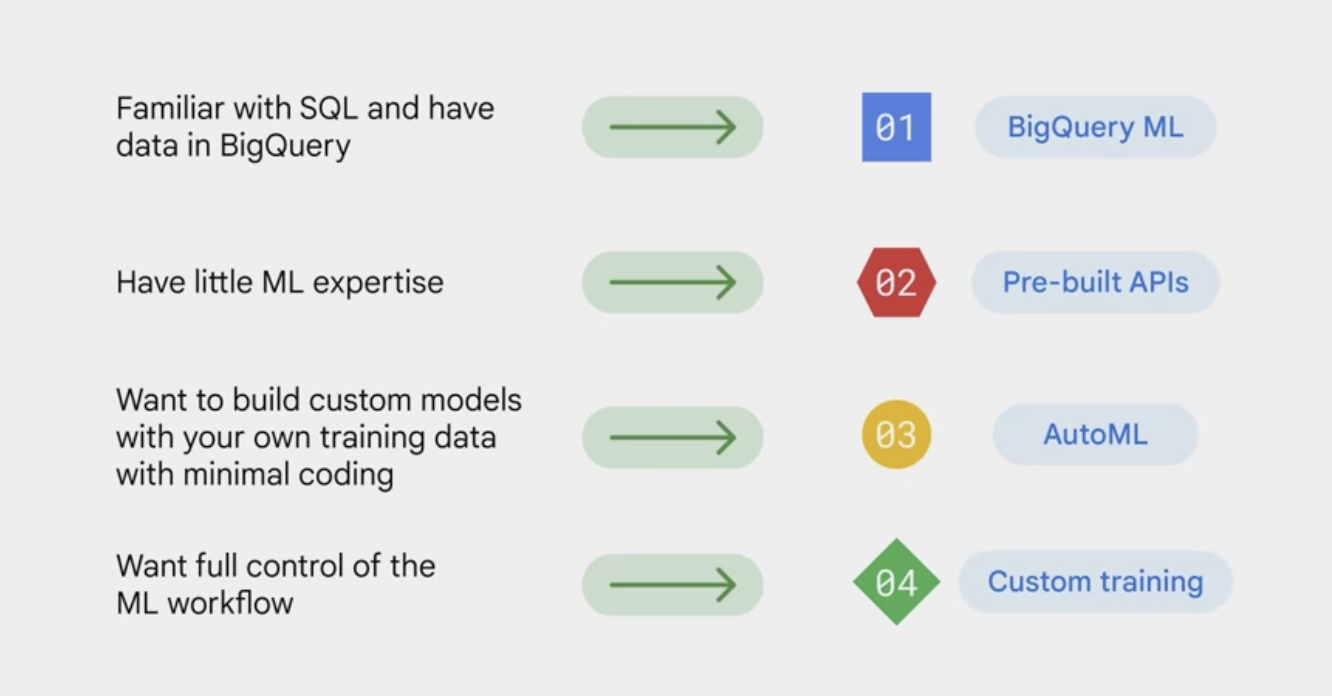
Selecting depend on the business needs and ML expertise.
- If the data engineers, data scientists, and data analysts are familiar with SQL and already have the data in BigQuery, BigQuery ML lets you develop SQL-based models.
- If the business users or developers have little ML experience, using pre-built APIs is likely the best choice. Pre-built APIs address common perceptual tasks, such as vision, video, and natural language. They are ready to use without any ML expertise or model development effort.
- If the developers and data scientists want to build custom models with the own training data while spending minimal time coding, then AutoML is the choice. AutoML provides a codeless solution to enable you to focus on business problems instead of the underlying model architecture and ML provisioning.
- If the ML engineers and data scientists want full control of ML workflow, Vertex AI custom training lets you train and serve custom models with code on vertex workbench. We’ve already explored BigQuery ML, so in the videos that follow, we’ll explore the other three options in more detail.
Pre-built APIs
- Good Machine Learning models require lots of high-quality training data. You should aim for hundreds of thousands of records to train a custom model.
- If you don’t have that kind of data, pre-built APIs are a great place to start.
- Pre-built APIs are offered as services.
- act as building blocks to create the application without expense or complexity of creating the own models.
- They save the time and effort of building, curating, and training a new dataset to just jump right ahead to predictions.
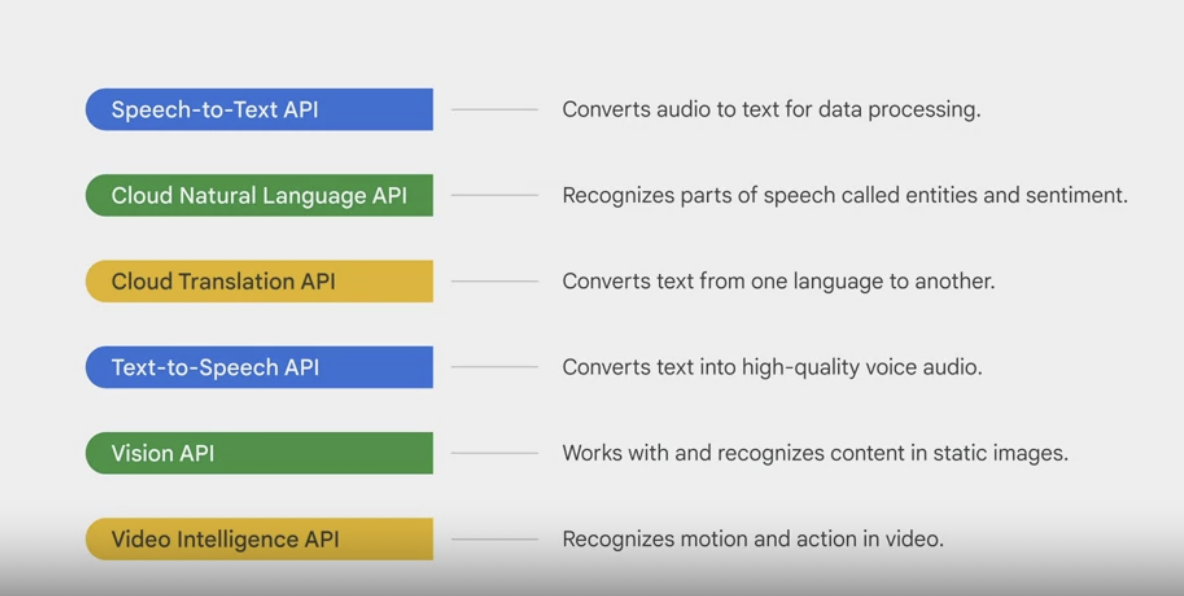
pre-built APIs
Speech-to-Text API: converts audio to text for data processing.Text-to-Speech API: converts text into high quality voice audio.Cloud Natural Language APIrecognizes parts of speech called entities and sentiment.Cloud Translation API” converts text from one language to another.Vision API- works with and recognizes content in static images.
Video Intelligence API: recognizes motion and action in video.
- Google has already done a lot of work to train these models using Google datasets.
- For example,
- the Vision API is based on Google’s image datasets,
- the Speech-to-Text API is trained on YouTube captions,
- the Translation API is built on Google’s neural machine translation technology.
- For example,
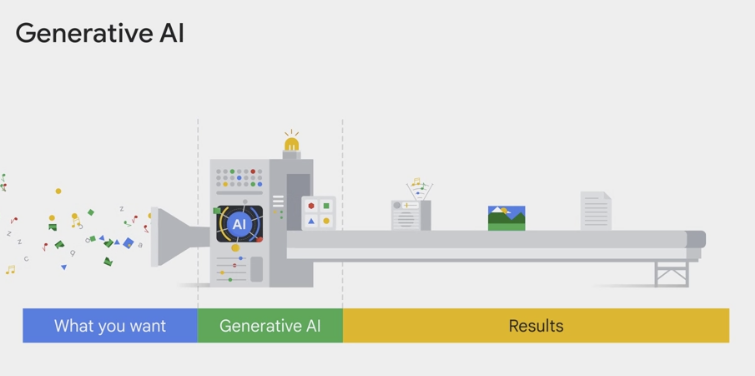
Gen AI
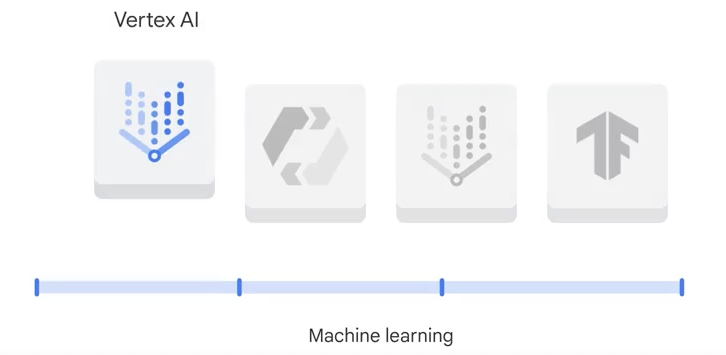
Vertex AI
AutoML
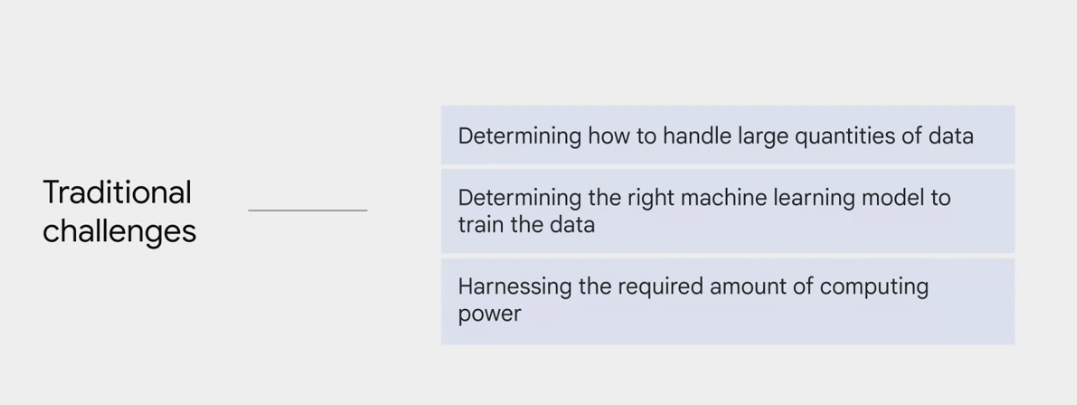
training and deploying ML models can be extremely time consuming, as need to repeatedly add new data and features, try different models, and tune parameters to achieve the best result.
AutoML
short for automated machine learning
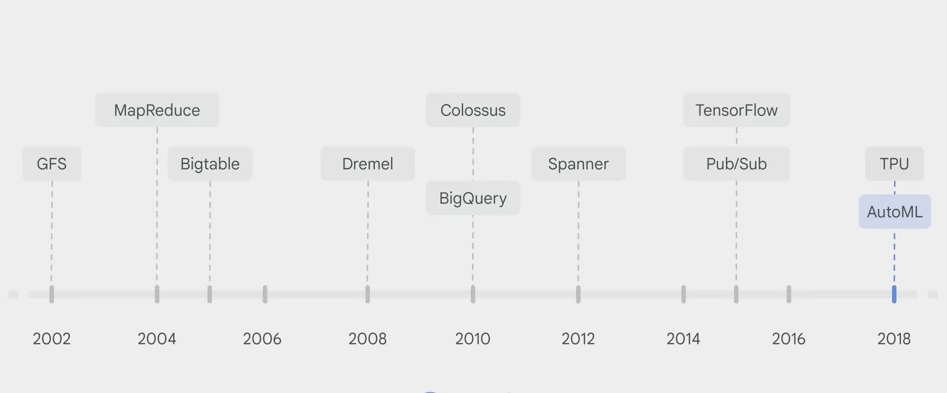
To solve this problem, when AutoML was first announced in January of 2018,
the goal was to automate machine learning pipelines to save data scientists from manual work, such as tuning hyperparameters and comparing against multiple models.
machine learning is similar to human learning.
- all starts with gathering the right information.
For AutoML, 2 technologies are vital.
transfer learning:- goal: build a knowledge base in the field.
- like gathering lots of books to create a library.
- a powerful technique that lets people with smaller datasets, or less computational power, achieve state-of-the-art results by
taking advantage of pre-trained modelsthat have been trained on similar, larger data sets. - Because the model learns via transfer learning, it
doesn’t have to learn from scratch, so it can generally reach higher accuracy with much less data and computation time than models that don’t use transfer learning.
neural architecture search.- goal: find the optimal model for the relevant project.
- like finding the best book in the library to help you learn what you need to.
- AutoML is powered by the latest machine-learning research, so although a model performs training, the AutoML platform actually trains and evaluates multiple models and compares them to each other.
- This neural architecture search produces an ensemble of ML models and chooses the best one.
Leveraging these technologies has produced a tool that can significantly benefit data scientists.
- One of the biggest benefits is that it’s a
no-code solution.- train high-quality custom machine learning models with minimal effort and requires little machine learning expertise.
- allows data scientists to focus their time on tasks like defining business problems or evaluating and improving model results.
- Others might find AutoML useful as a tool to quickly
prototype models and explore new datasetsbefore investing in development.- using it to identify the best features in a dataset,
AutoML supports 4 types of data:
- image, tabular, text, and video.
- For each data type, AutoML solves different types of problems, called objectives.
To get started,
- upload the data into AutoML (from Cloud Storage, BigQuery, or even the local machine).
- inform AutoML of the problems to solve.
- Some problems may sound similar to those mentioned in pre-built APIs.
- pre-built APIs use
pre-built machine learning models, - AutoML uses
custom-built models. In AutoML, you use the own data to train the machine learning model and then apply the trained model to predict the goal.
- For image data:
- use a
classification modelto analyze image data and return a list of content categories that apply to the image.- For example,
- train a model to classify images as containing a dog or not containing a dog,
- train a model to classify images of dogs by breed.
- For example,
- use an
object detection modelto analyze the image data and return annotations that consist of a label and bounding box location for each object found in an image.- For example
- train a model to find the location of the dogs in image data.
- For example
- use a
- For tabular data:
- use a
regression modelto analyze tabular data and return a numeric value.- For example
- train a model to estimate a house’s value or rental price based on a set of factors such as location, size of the house, and number of bedrooms.
- For example
- use a
classification modelto analyze tabular data and return a list of categories.- For example
- train a model to classify different types of land into high, median, and low potentials for commercial real estate.
- For example
- use
forecasting modelcan use multiple rows of time-dependent tabular data from the past to predict a series of numeric values in the future.- For example
- use the historical plus the economic data to predict what the housing market will look like in the next five years.
- For example
- use a
- For text data:
- use a
classification modelto analyze text data and return a list of categories that apply to the text found in the data.- For example
- can classify customer questions and comments to different categories and then redirect them to corresponding departments.
- For example
- An
entity extraction modelcan be used to inspect text data for known entities referenced in the data and label those entities in the text.- For example
- label a social media post in terms of predefined entities such as time, location, and topic, etc. This can help with online search, similar to the concept of a hashtag, but created by machine.
- For example
- And a
sentiment analysis modelcan be used to inspect text data and identify the prevailing emotional opinion within it, especially to determine a writer’s comment as positive, negative, or neutral.
- use a
- for video data:
- use a
classification modelto analyze video data and return a list of categorized shots and segments.- For example
- train a model that analyzes video data to identify whether the video is of a soccer, baseball, basketball, or football game
- For example
- use an
object trackingmodel to analyze video data and return a list of shots and segments where these objects were detected.- For example
- train a model that analyzes video data from soccer games to identify and track the ball.
- For example
- an
action recognition modelcan be used to analyze video data and return a list of categorized actions with the moments the actions happened.- For example
- train a model that analyzes video data to identify the action moments involving a soccer goal, a golf swing, a touchdown, or a high five.
- For example
- use a
Custom training
Vertex AI Workbench
to code the machine learning model, building a custom training solution with Vertex AI Workbench.
- Workbench is a single development environment for the entire data science workflow from exploring, to training and then deploying a machine learning model with code.
- Before any coding begins, you need to determine what environment you want, the ML training code to use.
pre-built container vs custom container
- pre built container
- if the ML training needs a platform like TensorFlow, Pytorch, Scikit-learn or XGboost and Python code to work with the platform
- custom container
- You define the exact tools, you need to complete the job.
AI Solution
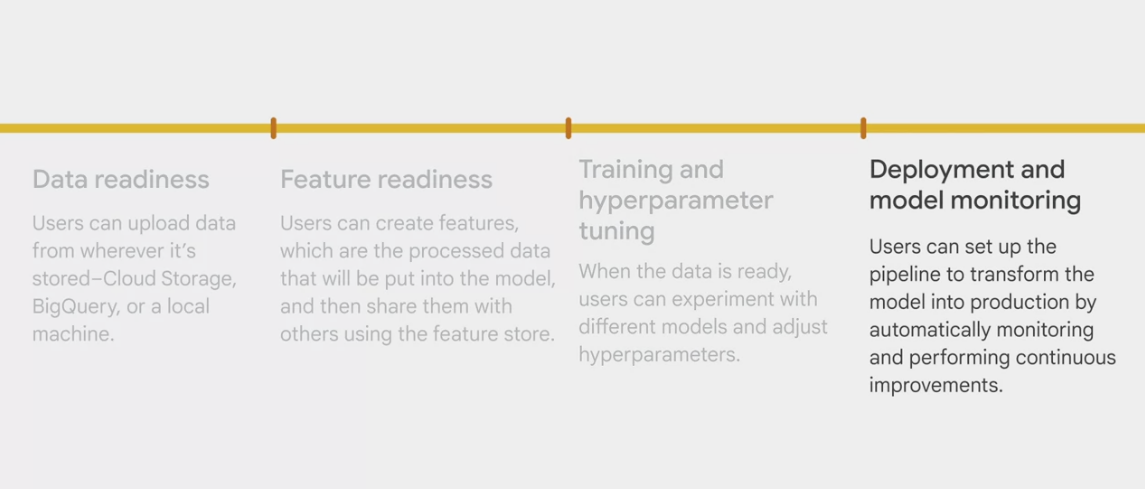
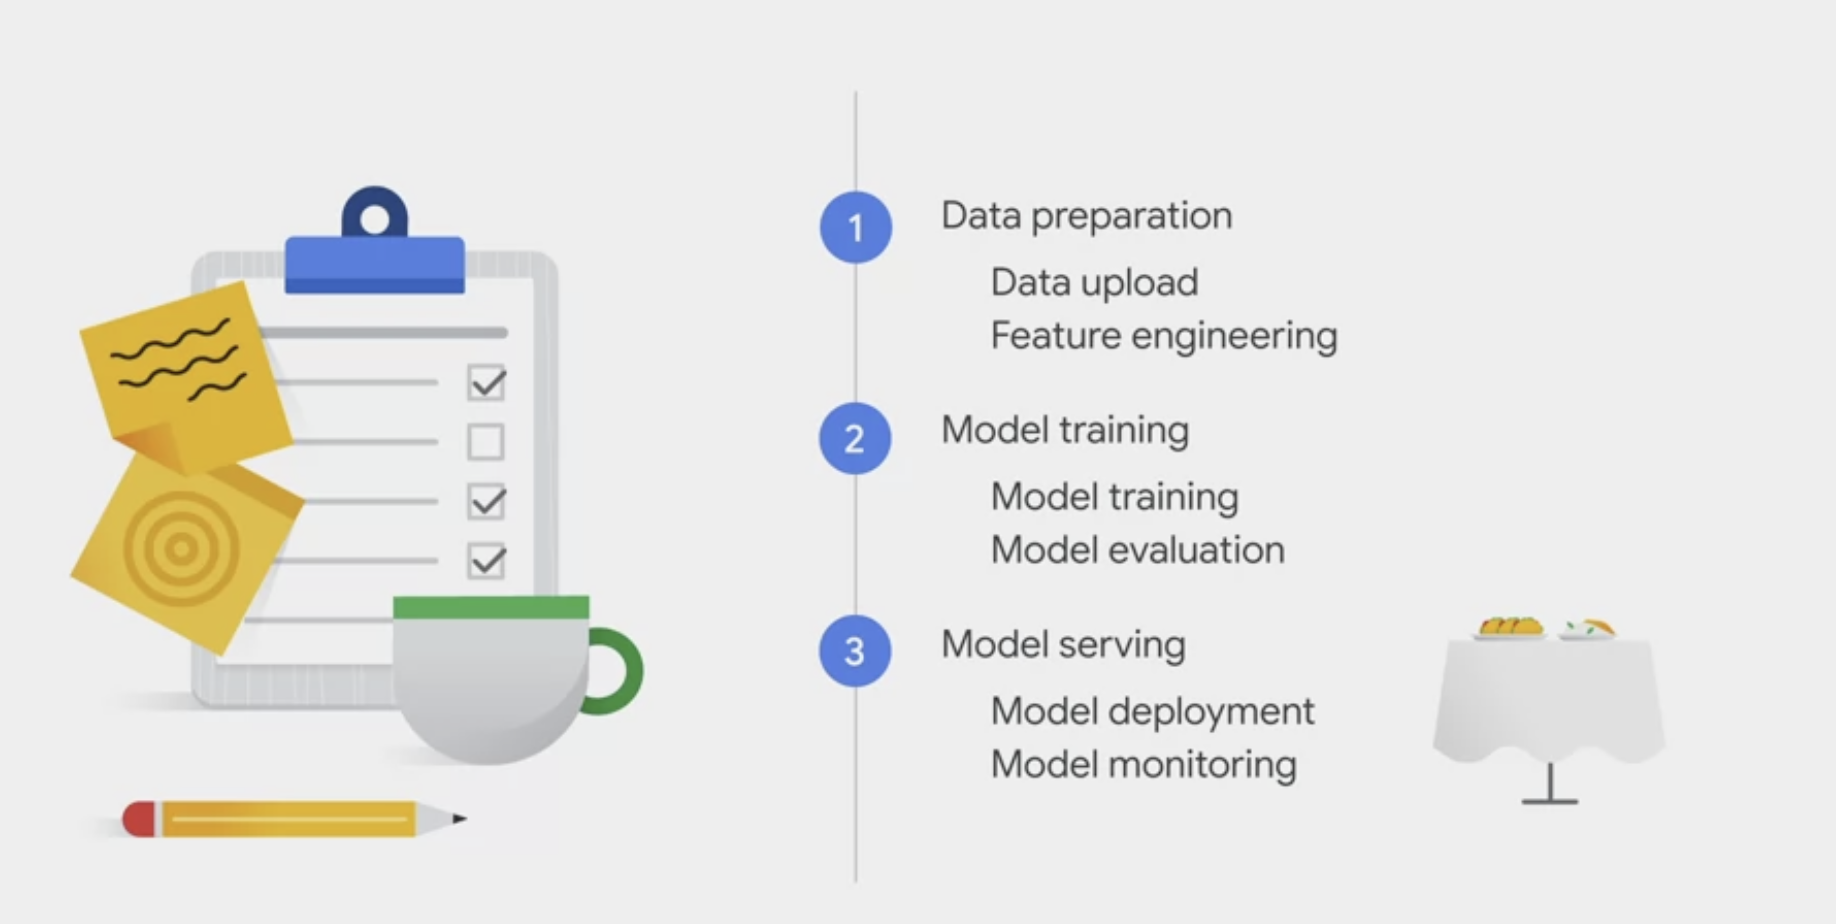
The Machine Learning Workflow with Vertex AI
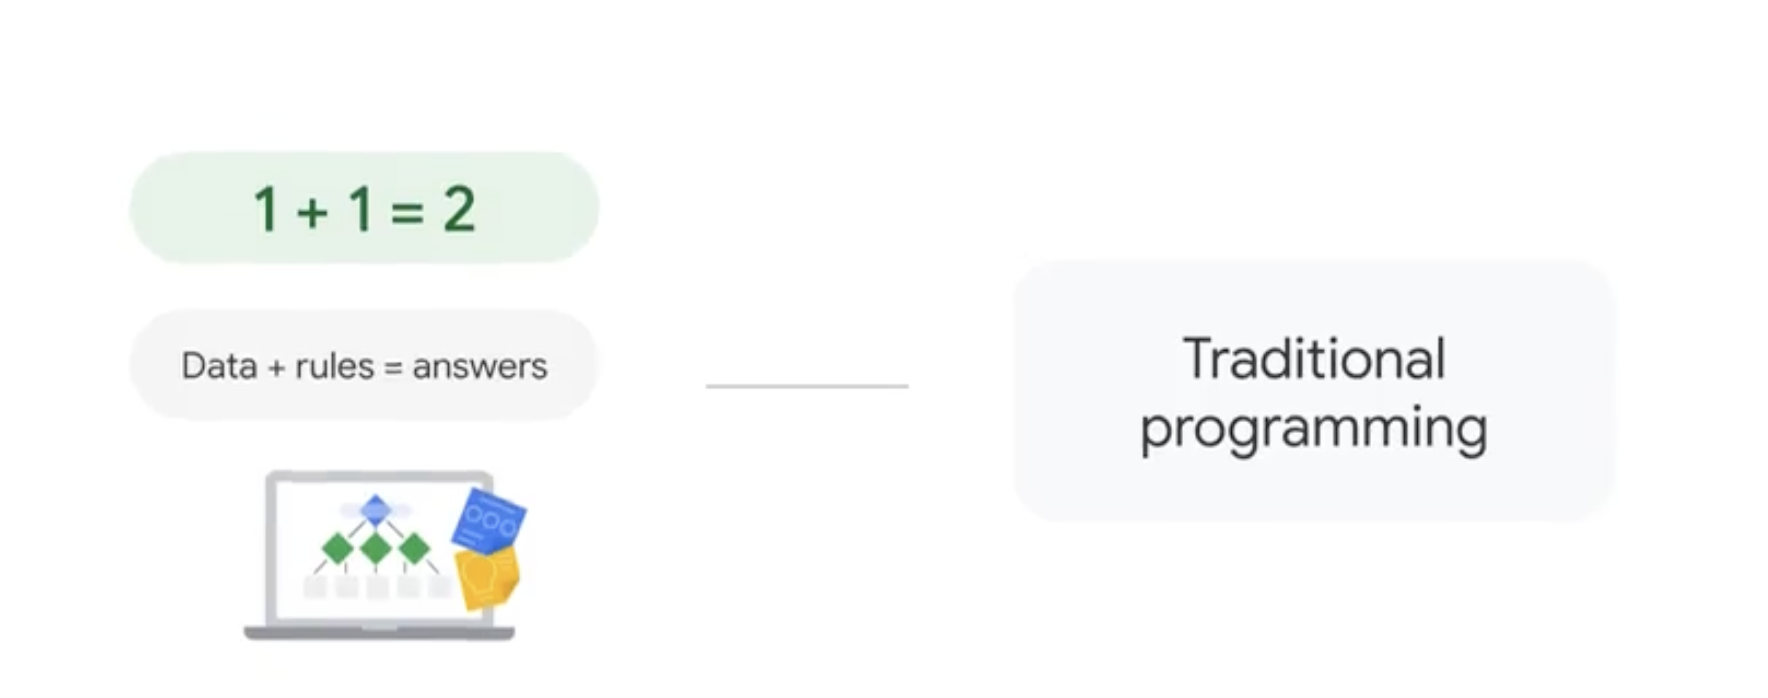
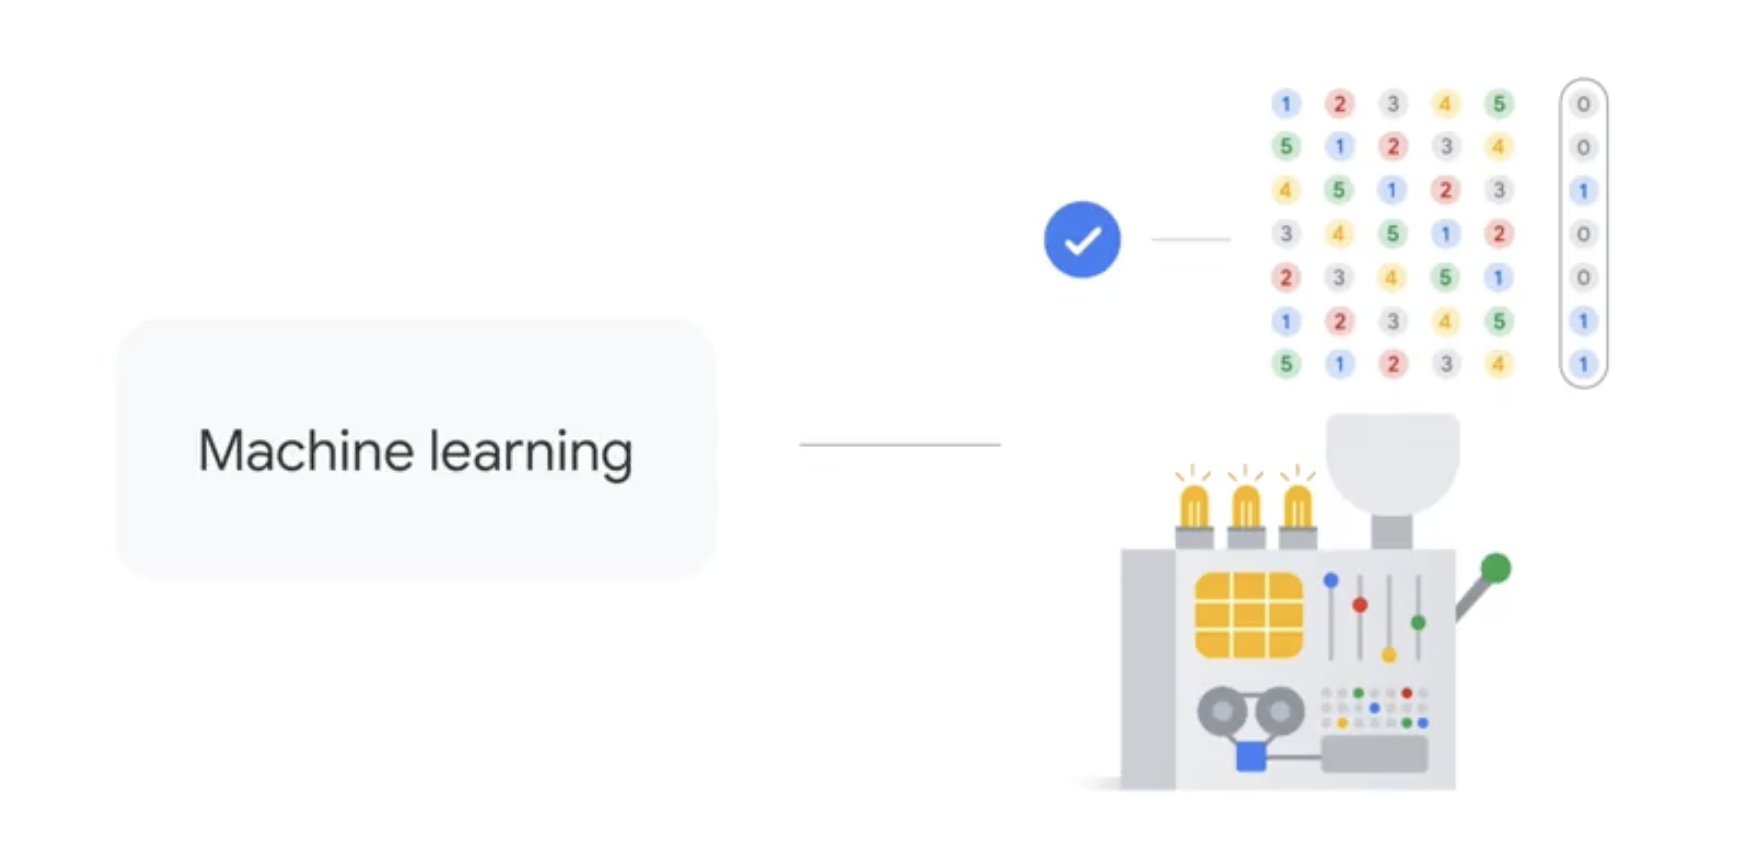
Tradition programming vs ML
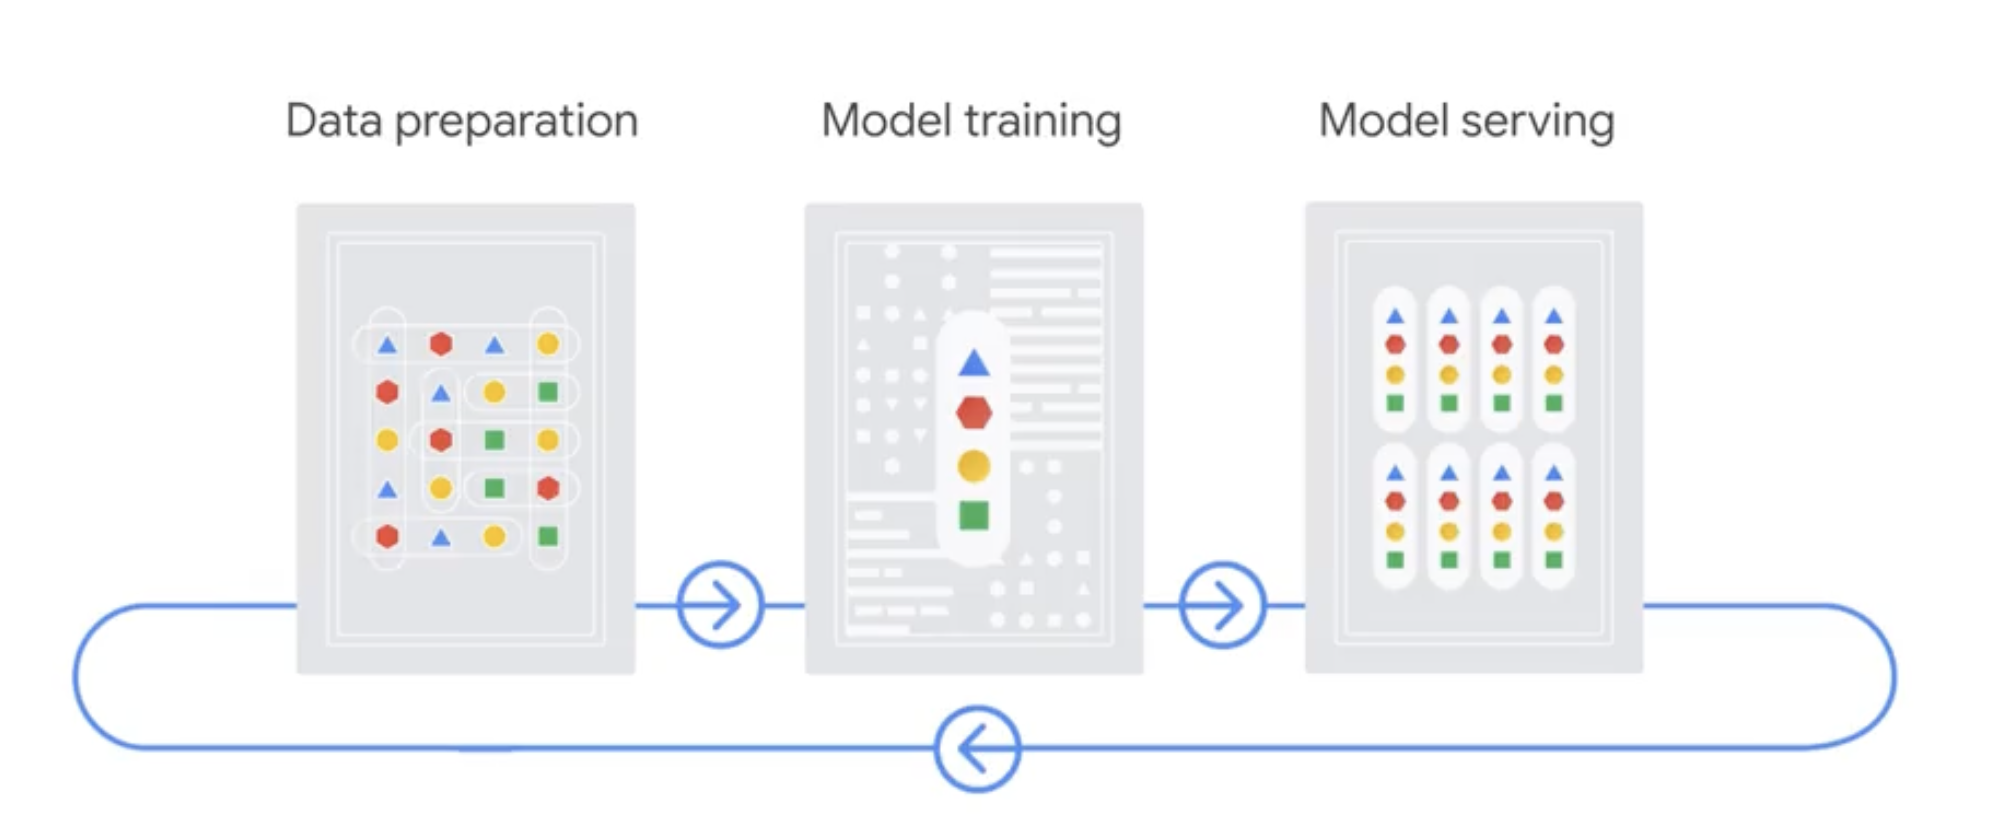
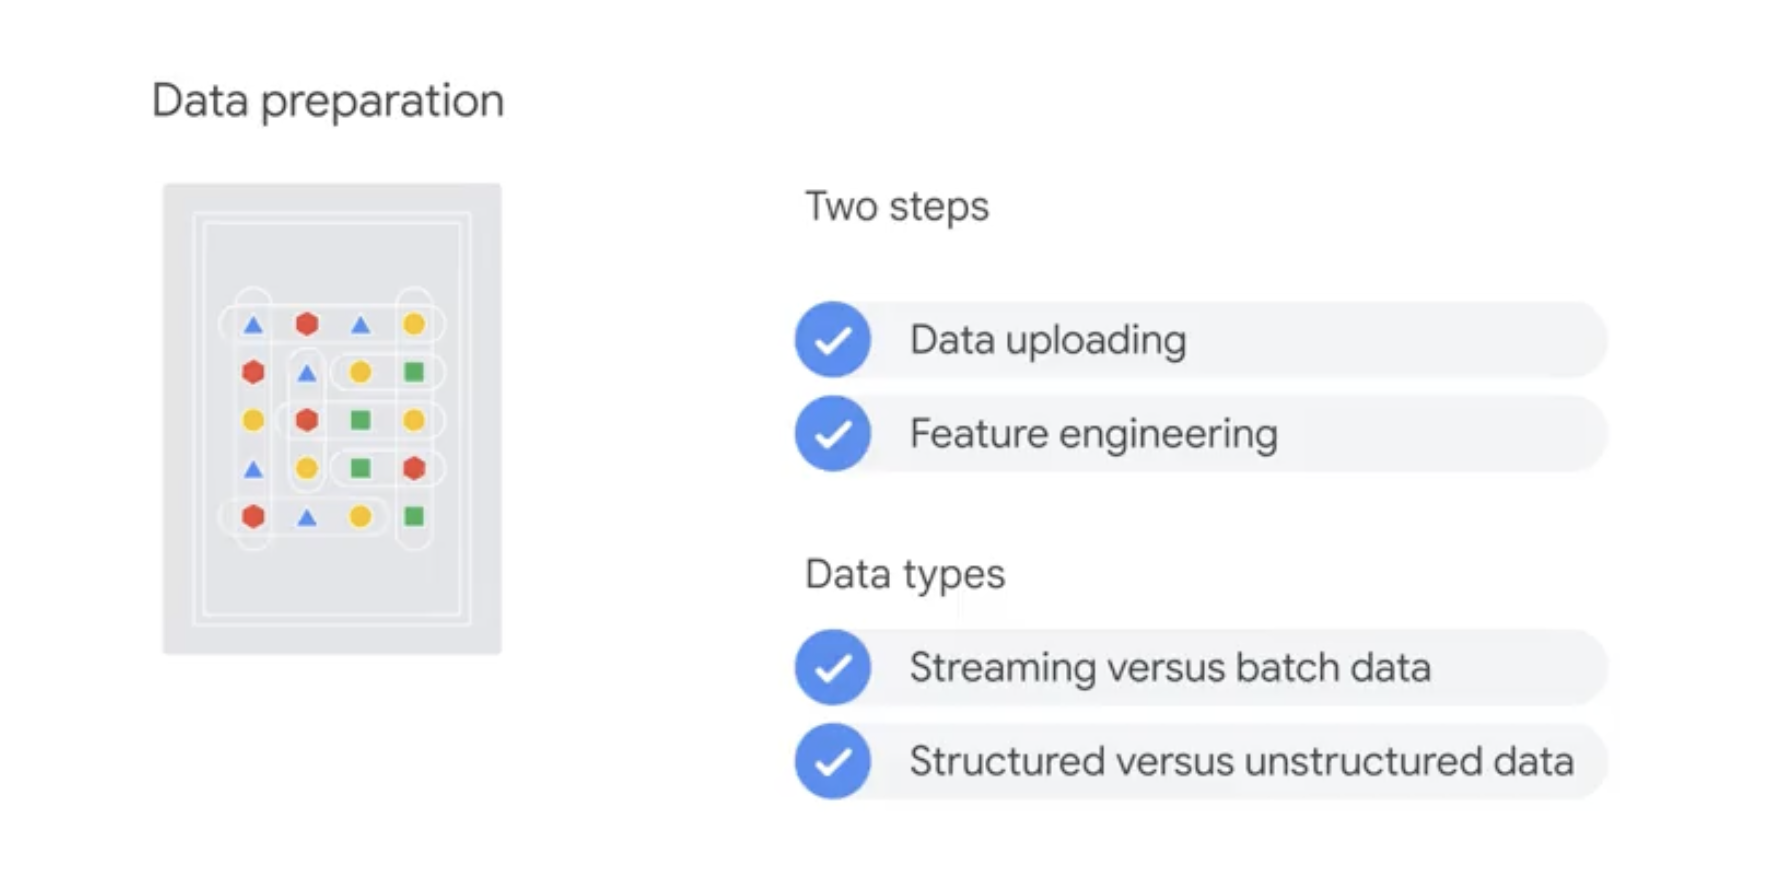
Data preparation
The first stage of the AutoML workflow is data preparation.
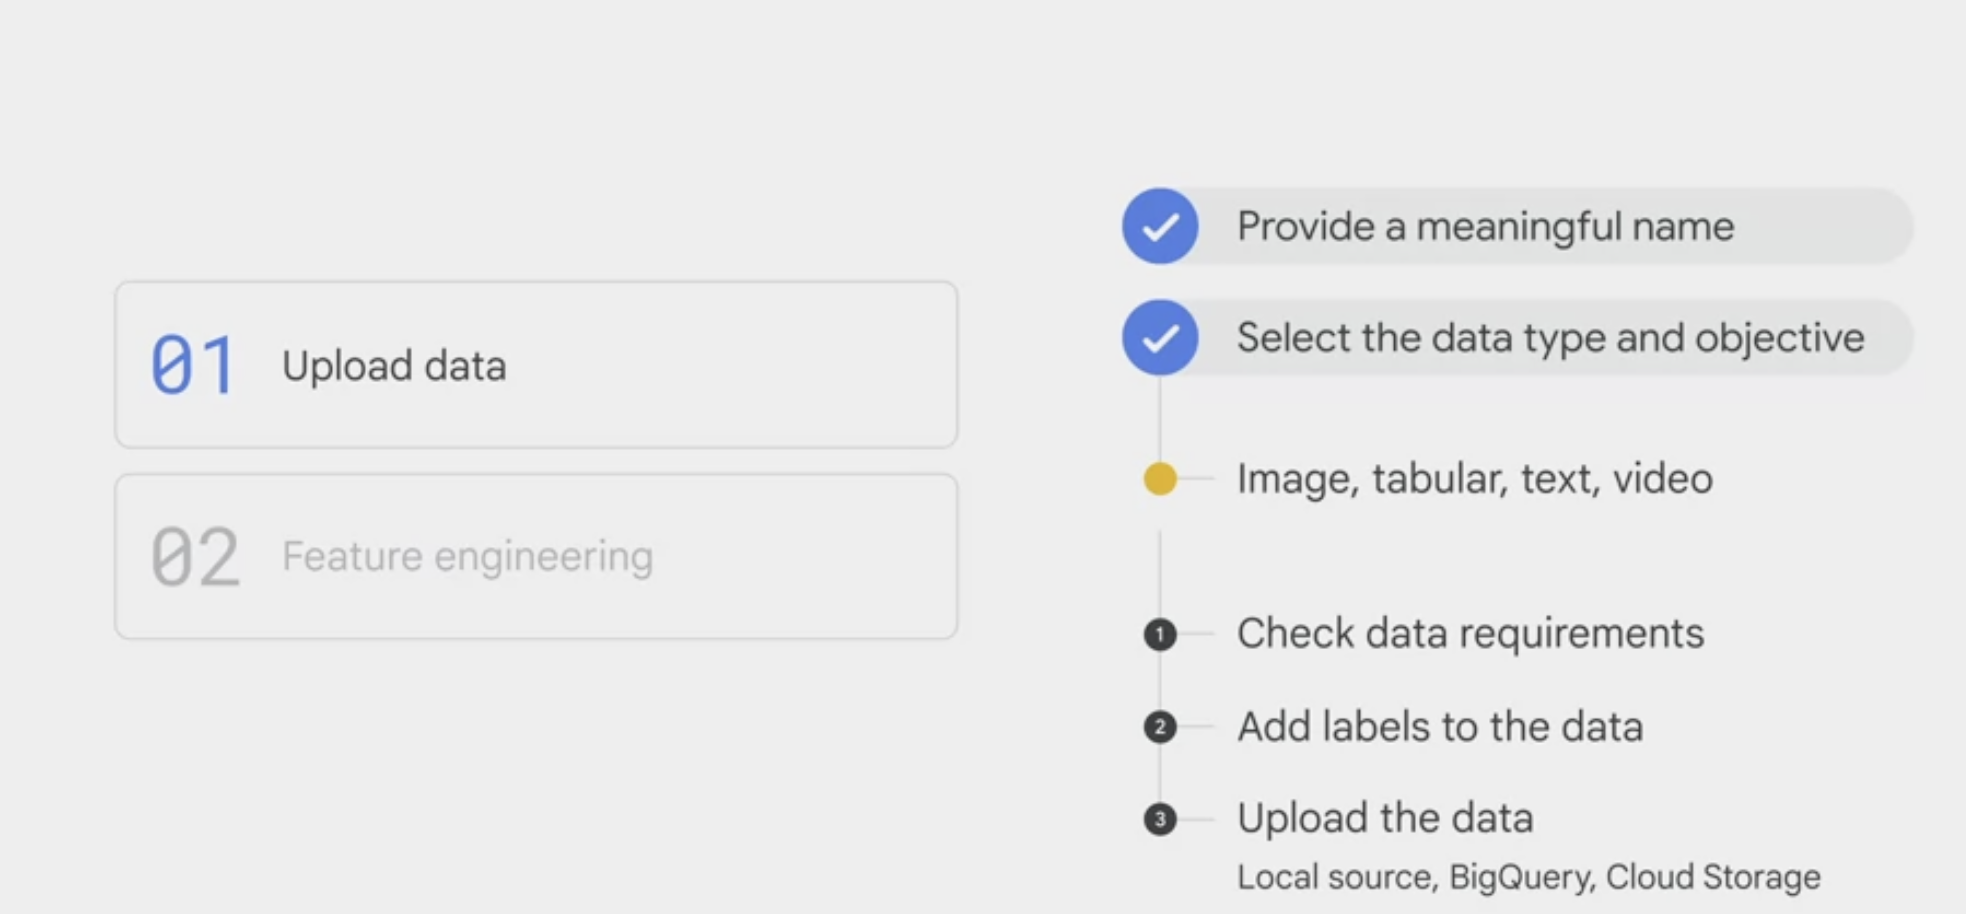
- upload data
- provide a meaningful name for the data
- select the data type and objective.
- AutoML allows four types of data: image, tabular, text, and video.
- add labels to the data
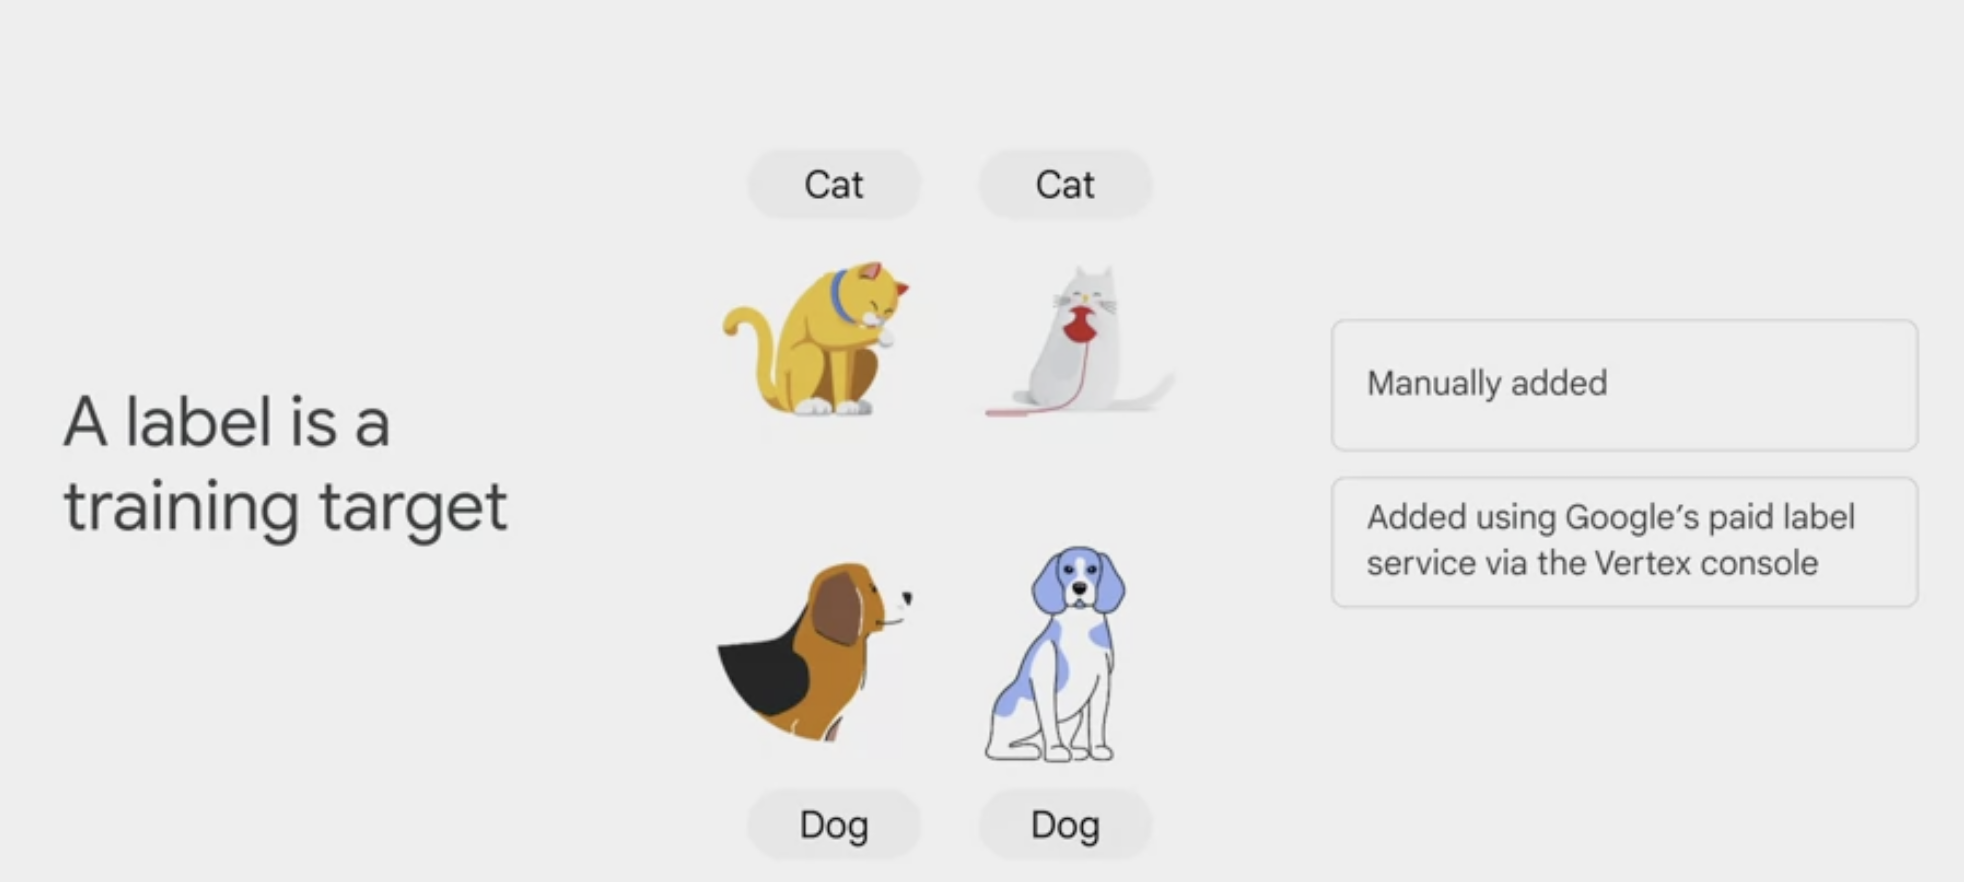
- A label is a training target.
- if you want a model to distinguish a cat from a dog, you must first provide sample images that are tagged or labeled either cat or dog.
- A label can be manually added, or it can be added by using Google’s paid label service via the Vertex console.
- upload the data. Data can be uploaded from a local source, BigQuery, or Cloud Storage.
prepare the data for model training with feature engineering.
- the data must be processed before the model starts training.
- A feature, refers to
a factor that contributes to the prediction. - It’s an independent variable in statistics or a column in a table.
- Preparing features can be both challenging and tedious.
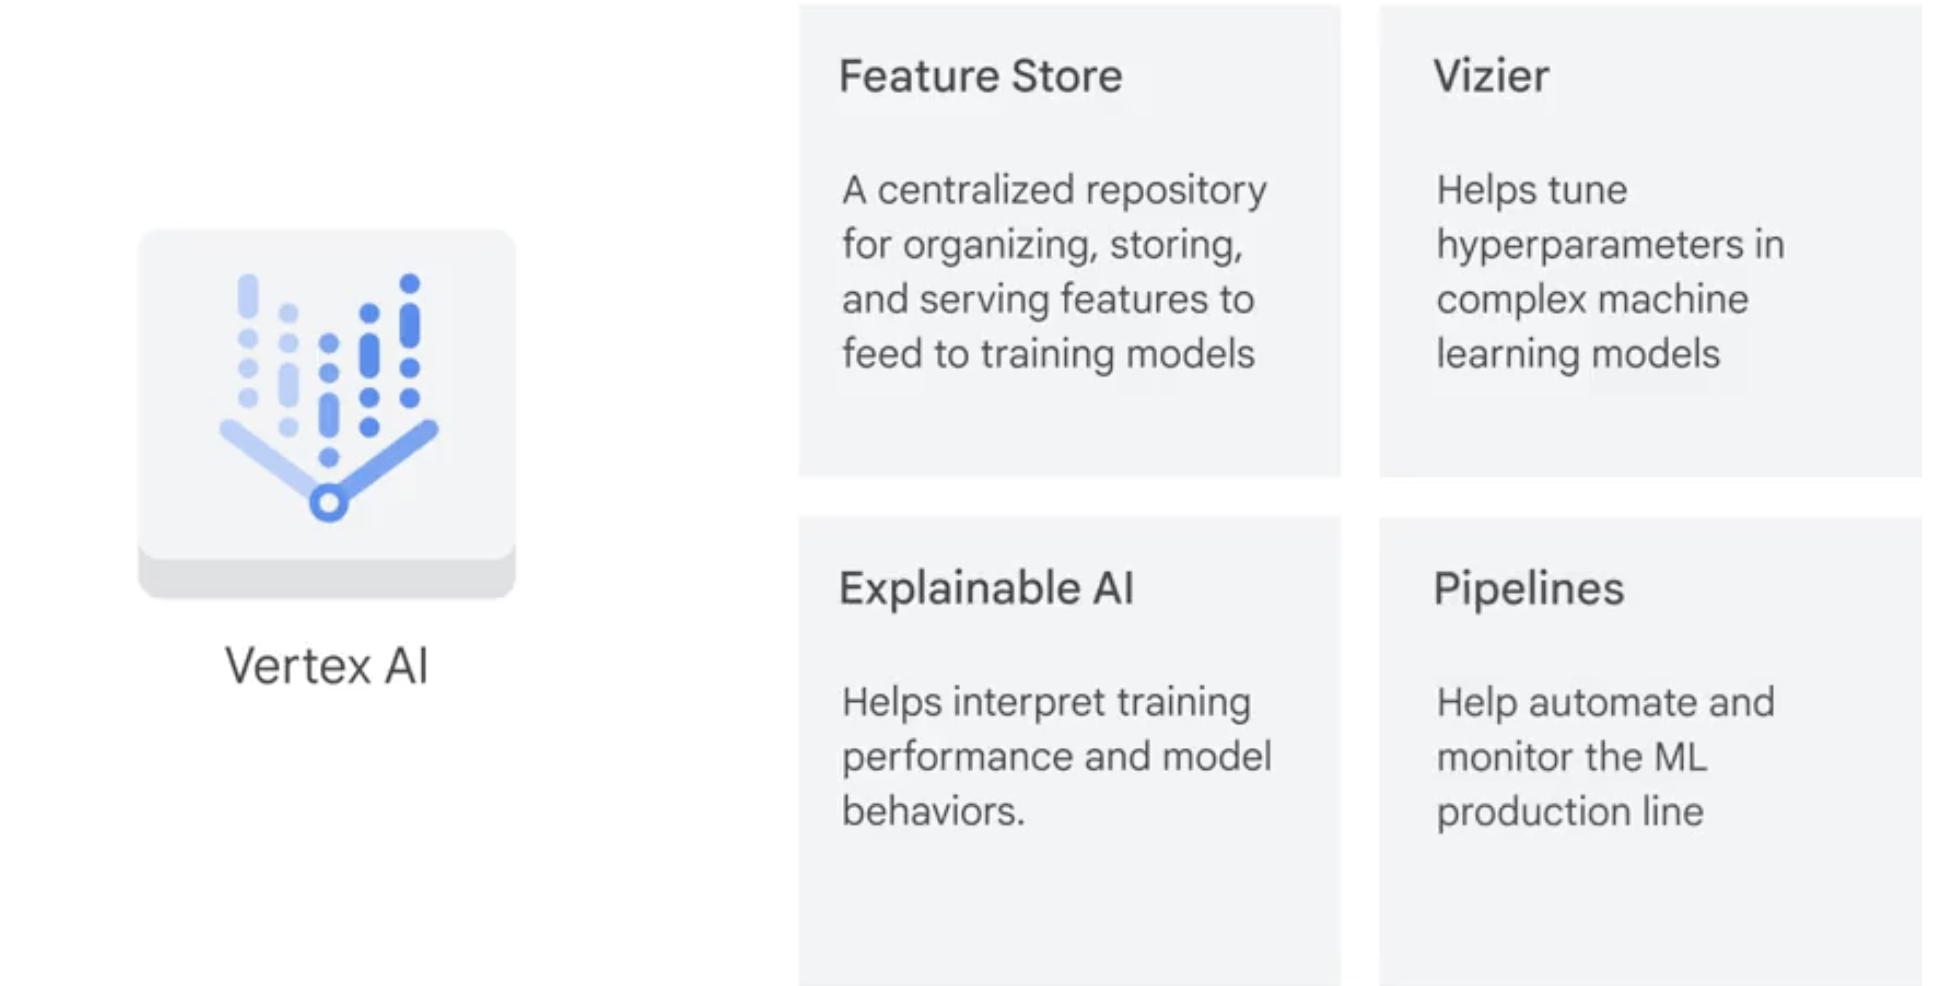
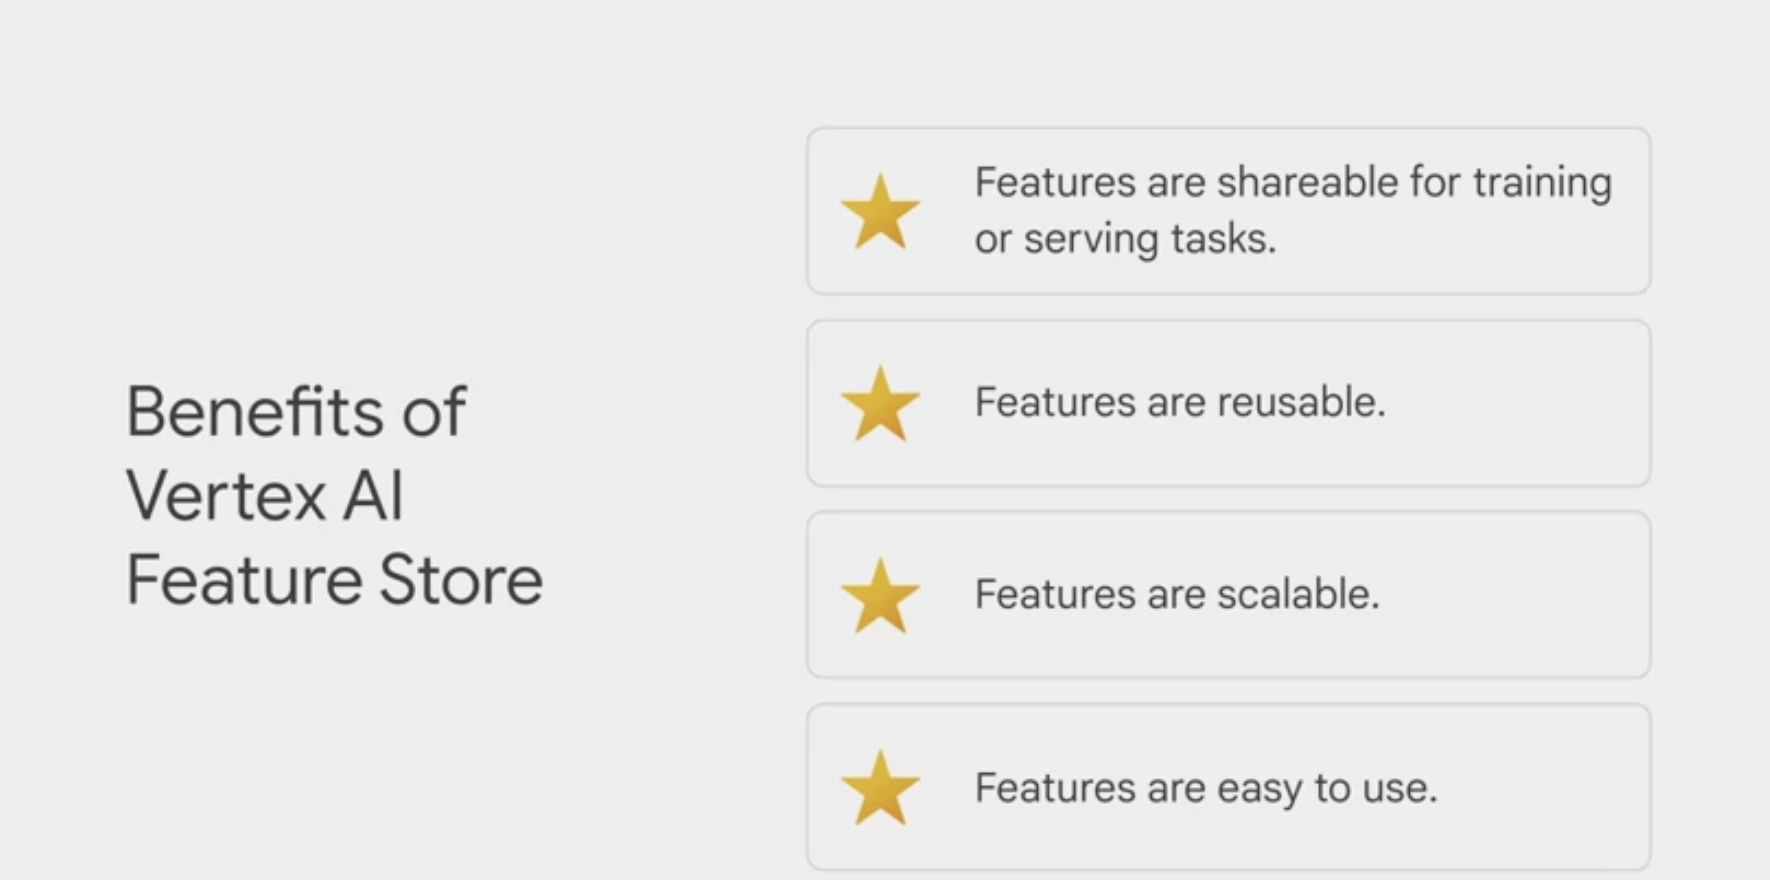
- Vertex AI has a function called Feature Store.
- a centralized repository to organize, store, and serve machine learning features. It aggregates all the different features from different sources and updates them to make them available from a central repository. Then, when engineers need to model something, they can use the features available in the Feature Store dictionary to build a dataset. Vertex AI automates the feature aggregation to scale the process.
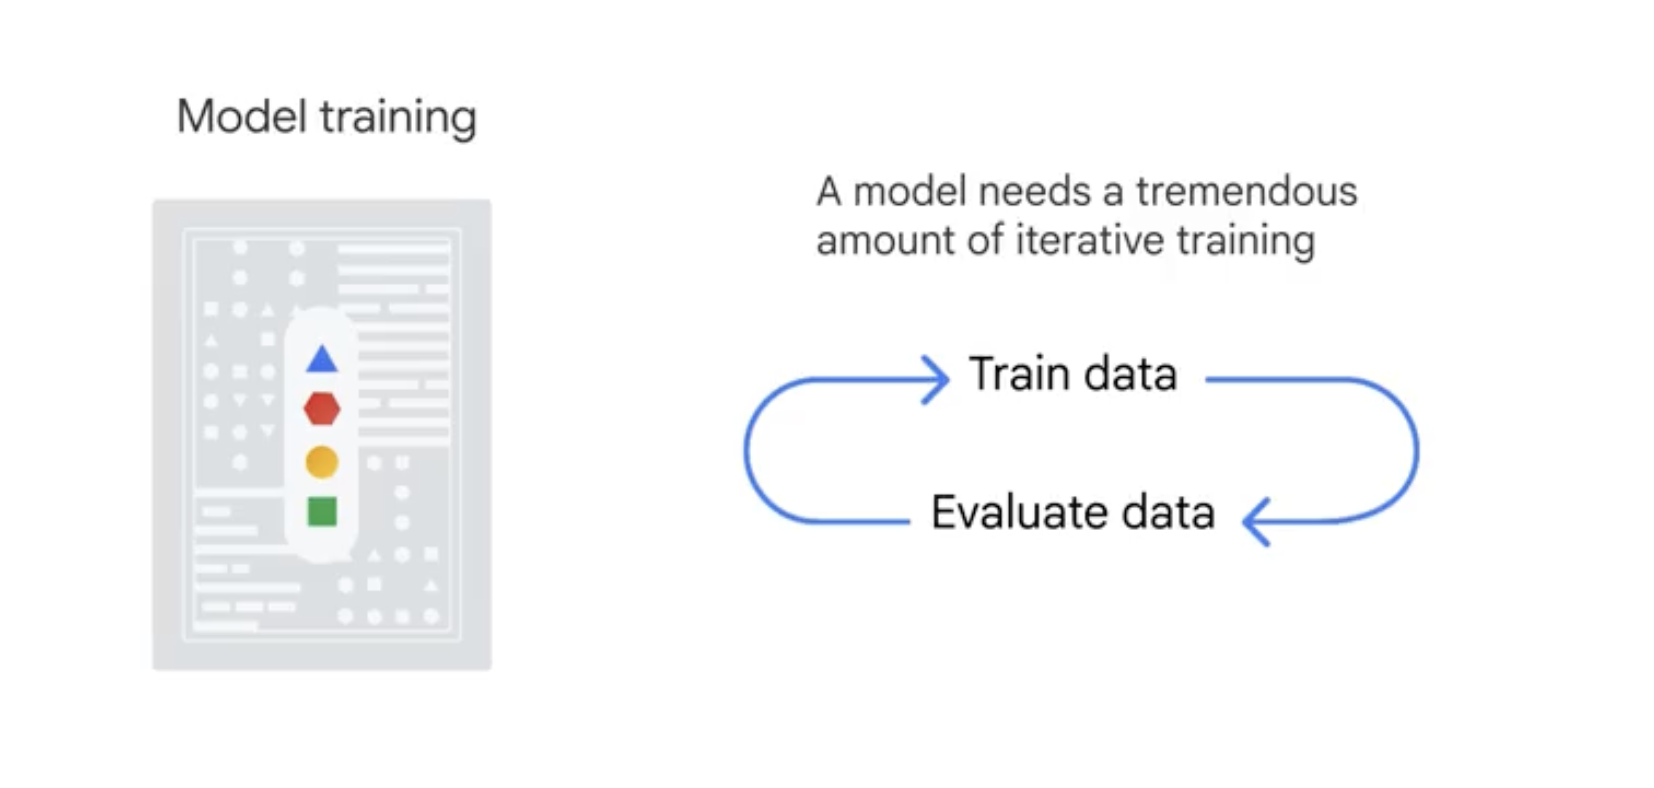
Model training
- model training, which would be like cooking the recipe,
- model evaluation, which is when we taste how good the meal is. This process might be iterative.
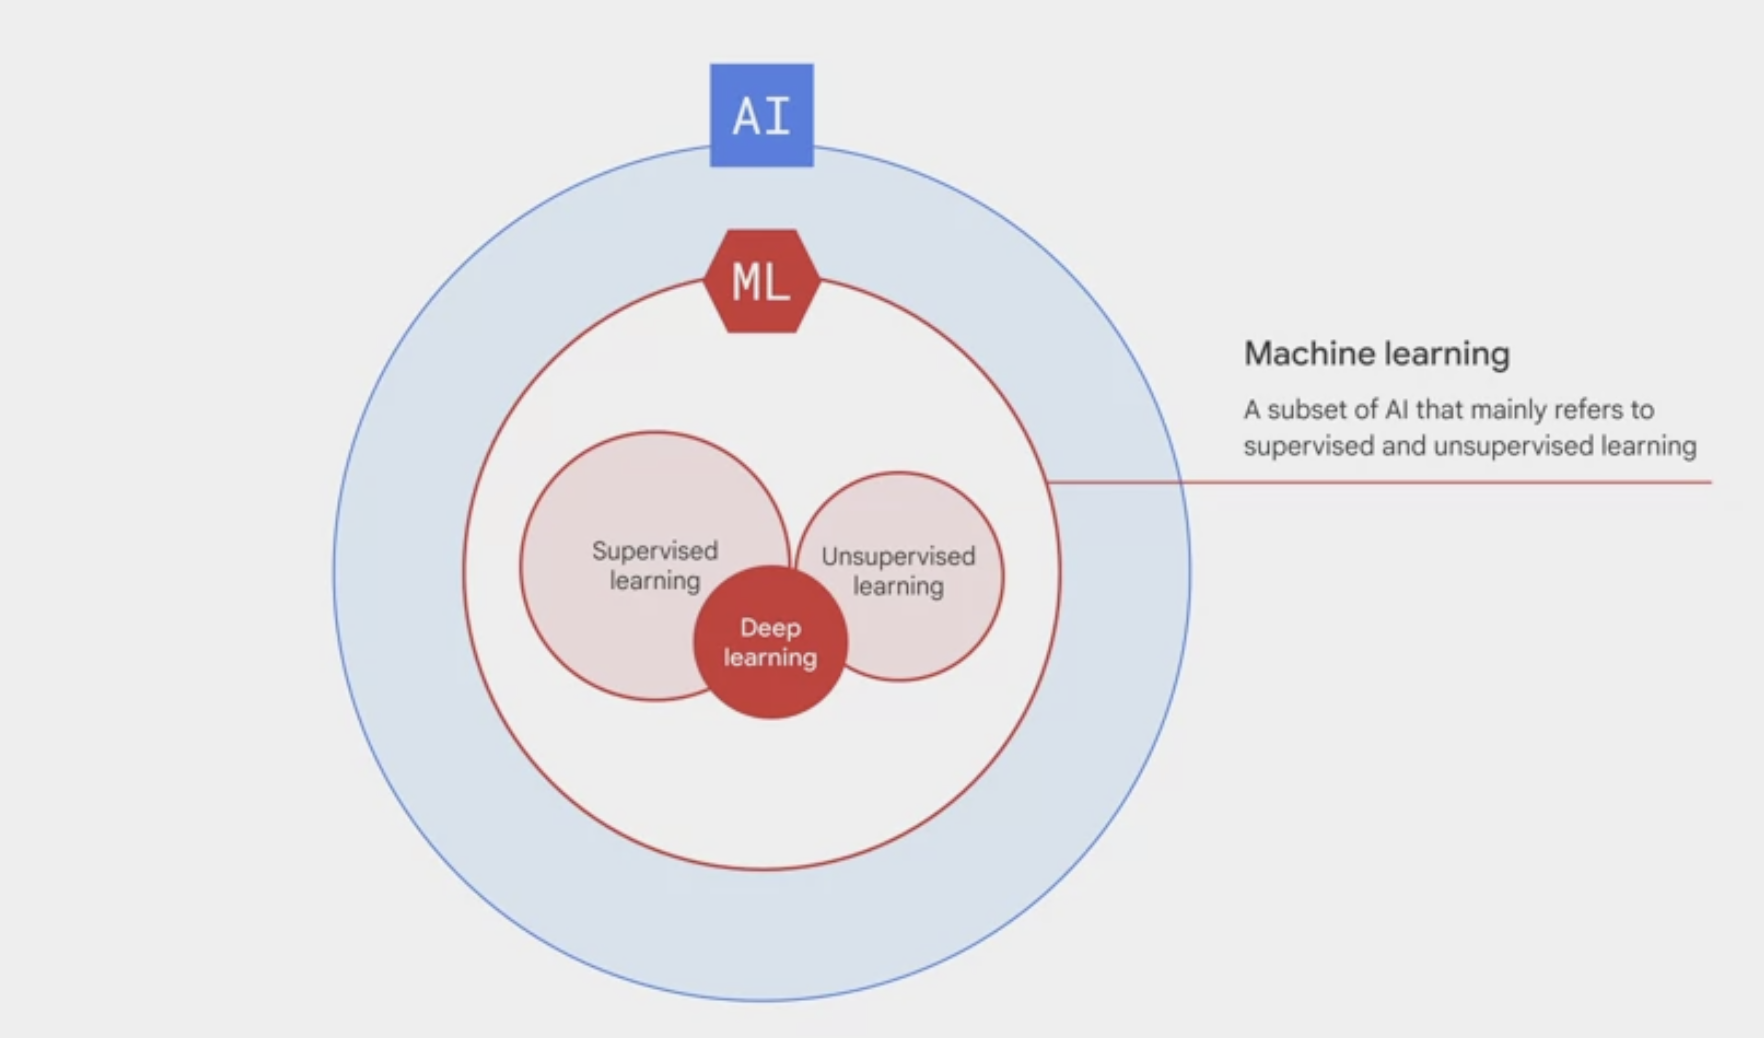
artificial intelligence vs machine learning
- Artificial intelligence: an umbrella term that includes anything related to computers mimicking human intelligence.
- For example, in an online word processor, robots performing human actions all the way down to spell check.
- Machine learning:
- a subset of AI that mainly refers to supervised and unsupervised learning. You might also hear the term deep learning, or deep neural networks. It’s a subset of machine learning that adds layers in between input data and output results to make a machine learn at more depth.
supervised vs unsupervised learning
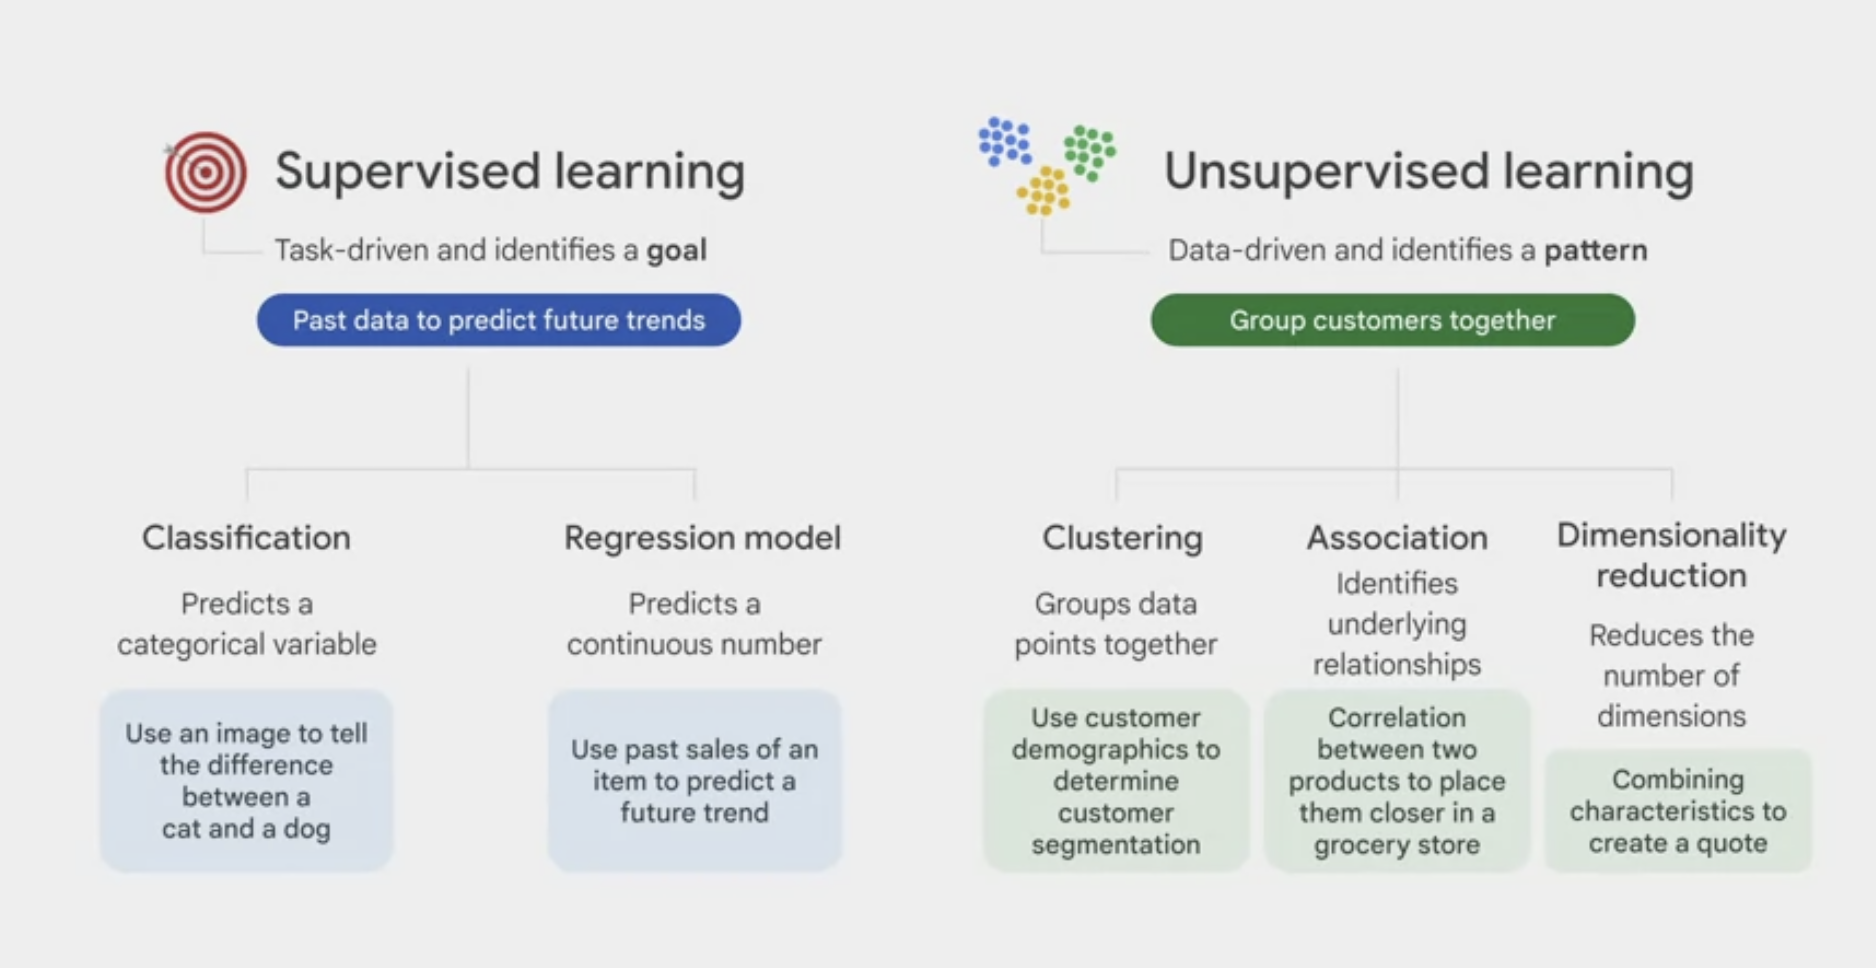
supervised learning provides each data point with a label, or an answer, while unsupervised does not.
- Supervised learning
- task-driven and identifies a goal.
- 2 major types of supervised learning:
classification model, which predicts a categorical variable, like using an image to tell the difference between a cat and a dog.regression model, which predicts a continuous number, like using past sales of an item to predict a future trend.
- Unsupervised learning
- data-driven and identifies a pattern.
- 3 major types of unsupervised learning:
clustering, which groups together data points with similar characteristics and assigns them to “clusters,” like using customer demographics to determine customer segmentation.association, which identifies underlying relationships, like a correlation between two products to place them closer together in a grocery store for a promotion.dimensionality reduction, which reduces the number of dimensions, or features, in a dataset to improve the efficiency of a model. For example, combining customer characteristics like age, driving violation history, or car type, to create an insurance quote. If too many dimensions are included, it can consume too many compute resources, which might make the model inefficient.
four machine learning options
AutoML and pre-built APIs: don’t need to specify a machine learning model. Instead, define the objective, such as text translation or image detection. Then on the backend, Google will select the best model to meet the business goal.
BigQuery ML and custom training: need to specify which model to train the data on and assign something called
hyperparameters(user-defined knobs in a machine that helps guide the machine learning process).- For example, one parameter is a learning rate, which is how fast you want the machine to learn With AutoML, you don’t need to worry about adjusting these hyperparameter knobs because the tuning happens automatically in the back end. This is largely done by a neural architect search, which finds the best fit model by comparing the performance against thousands of other models.
Model evaluation
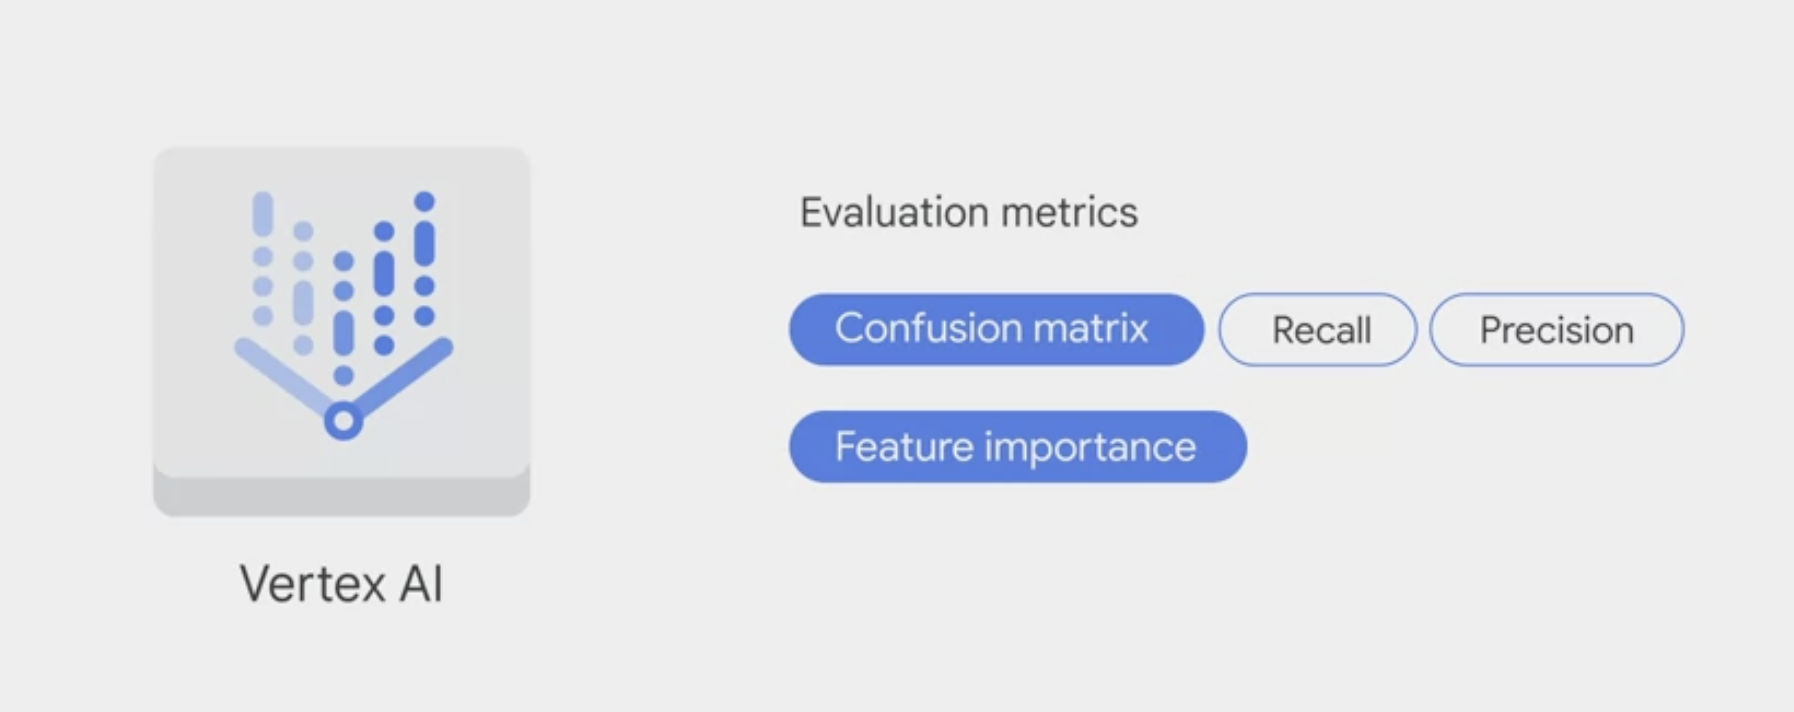
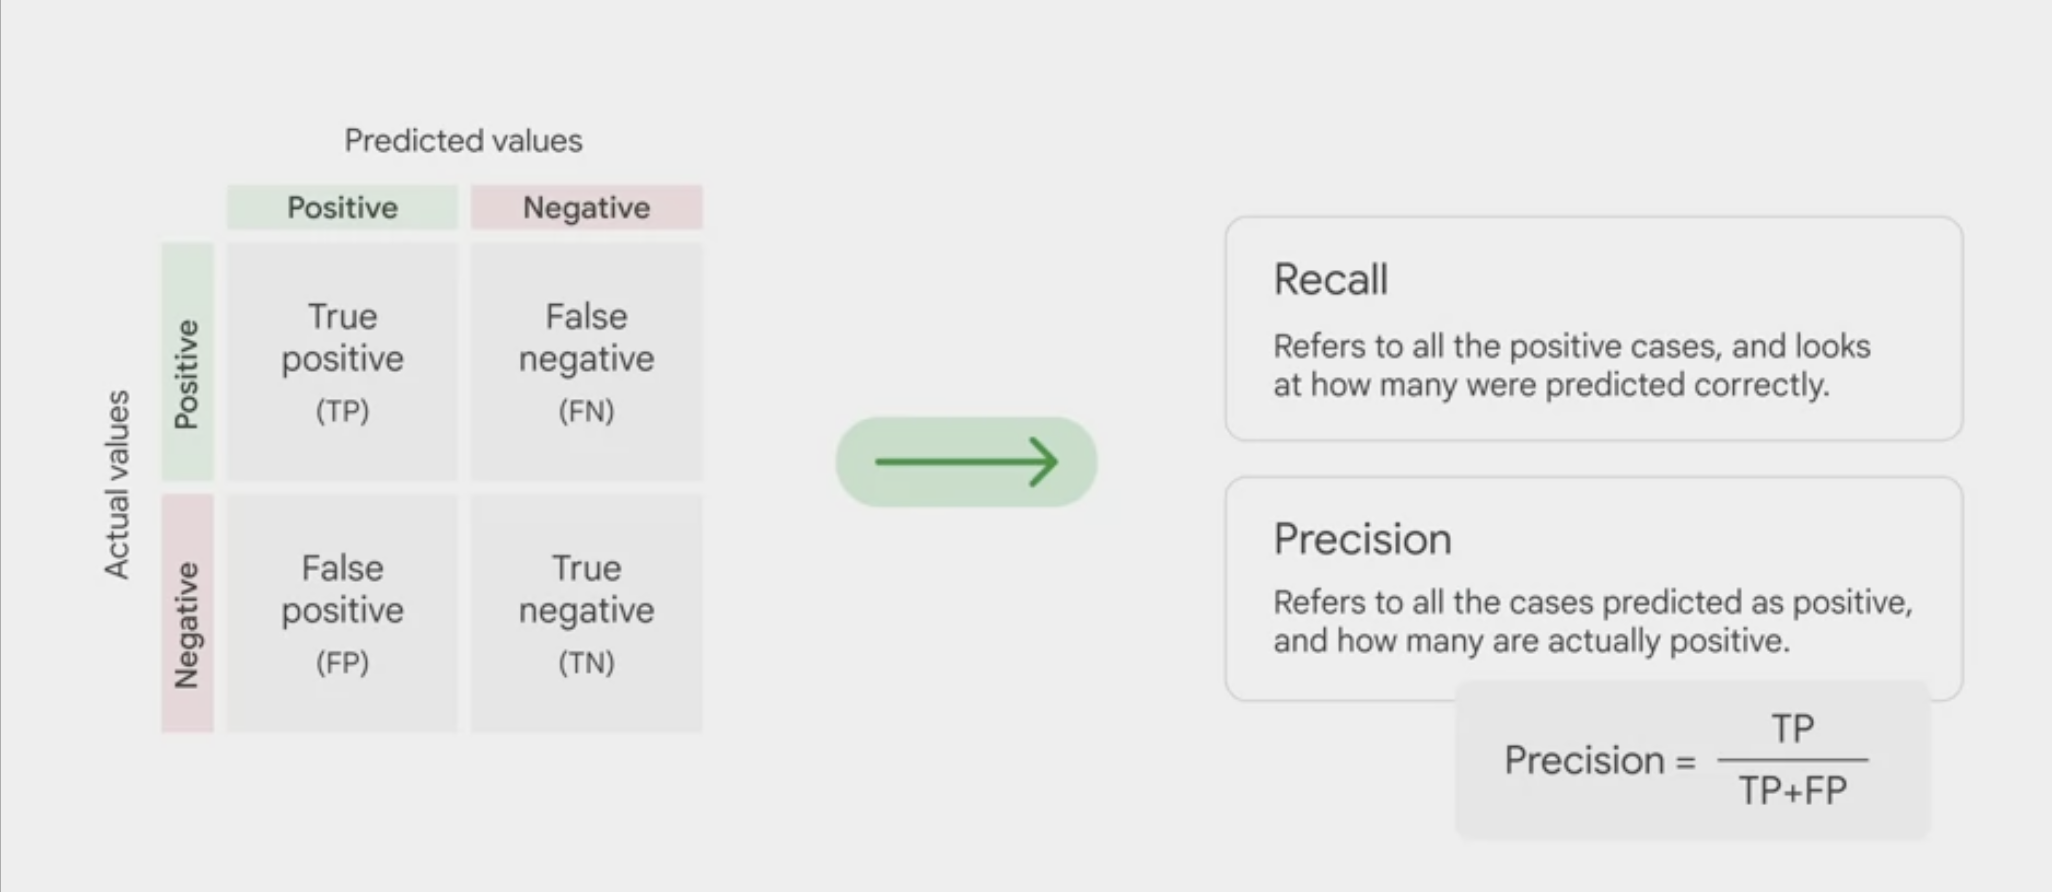
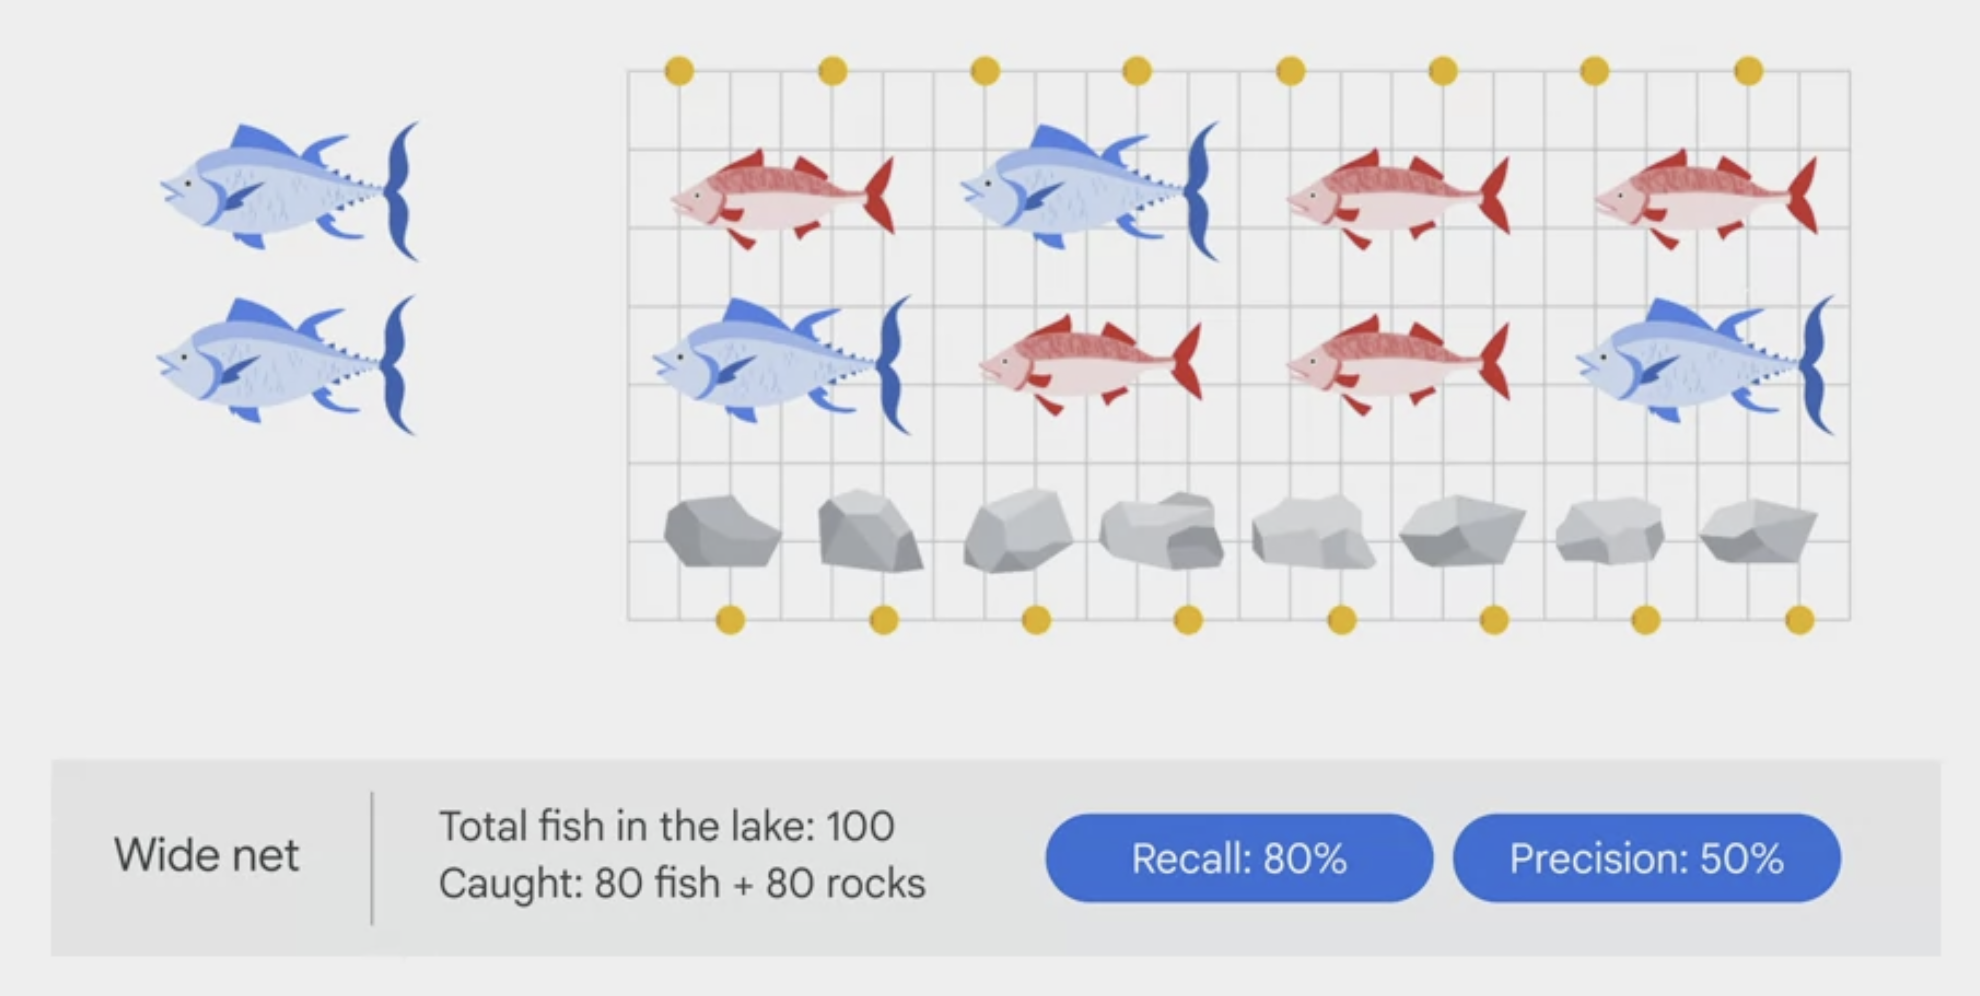
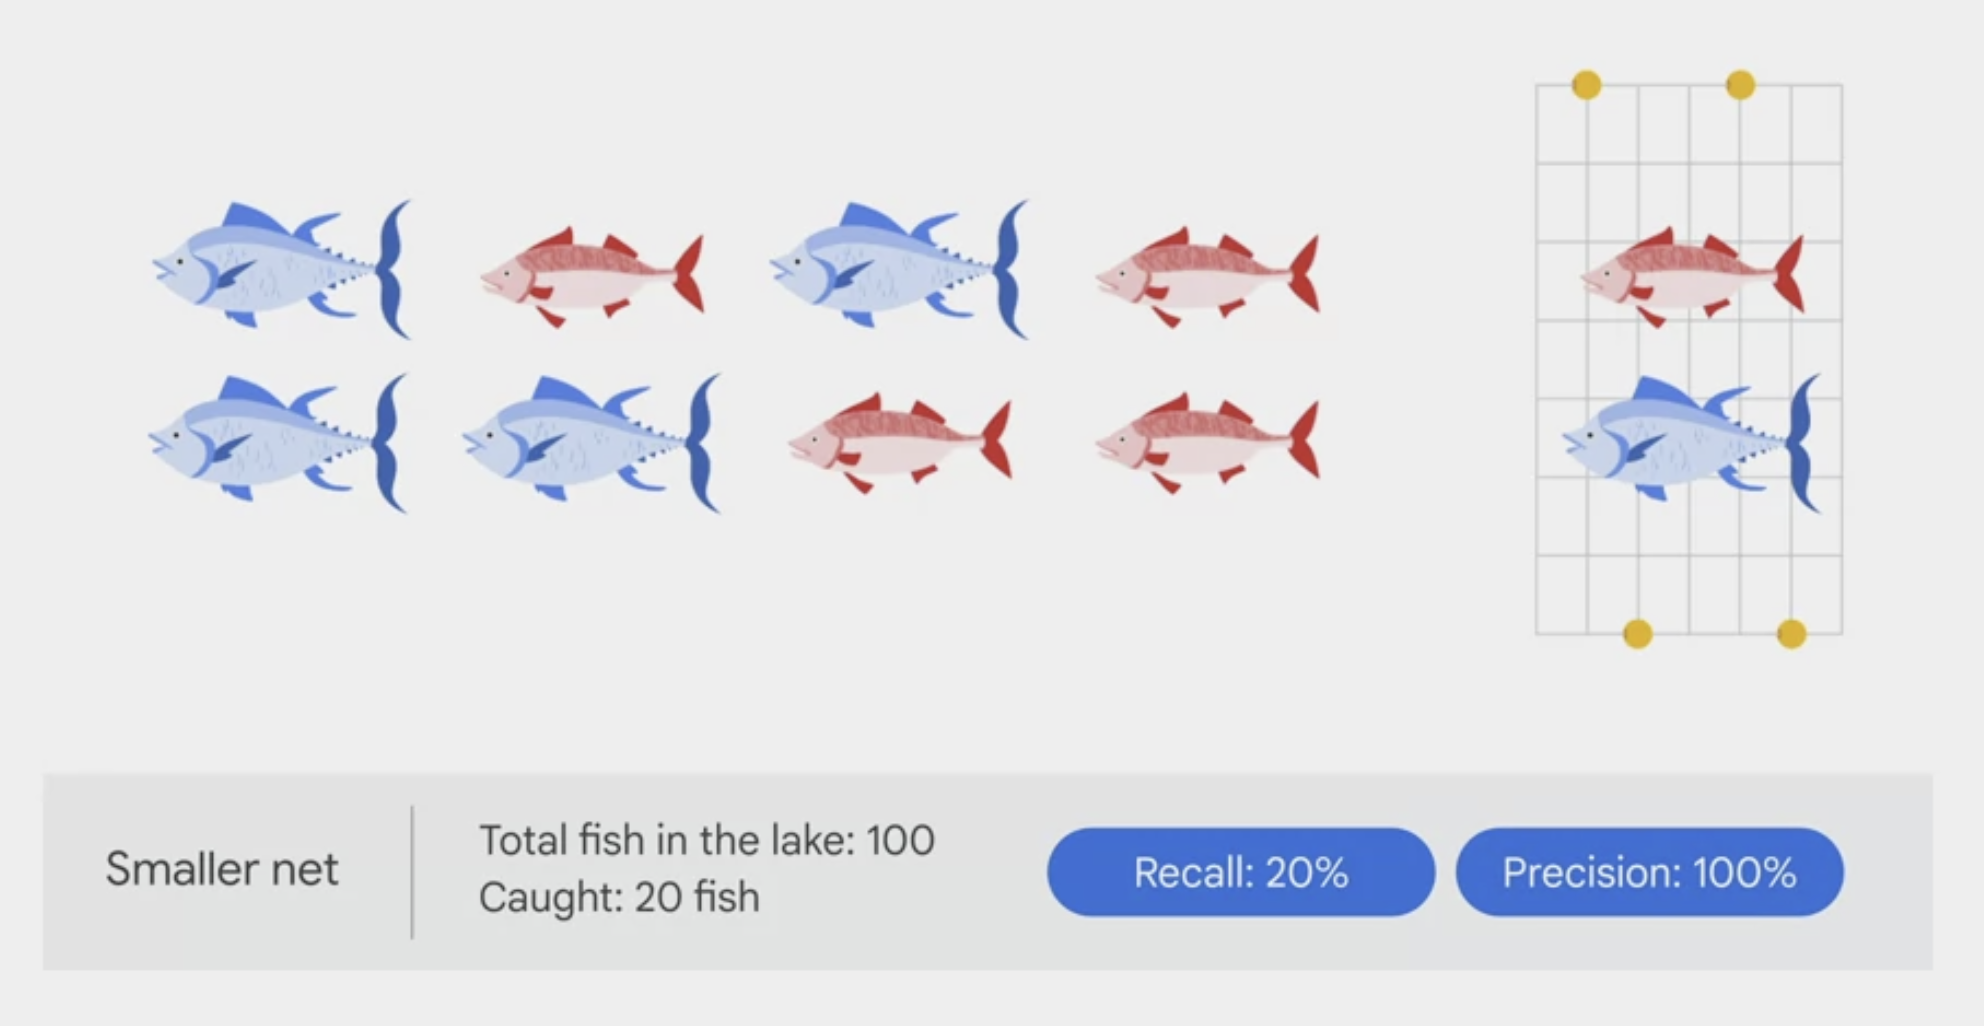
Vertex AI provides many metrics to evaluate the model performance. focus on three:
- Precision/Recall curve
- Confusion Matrix
- Feature Importance
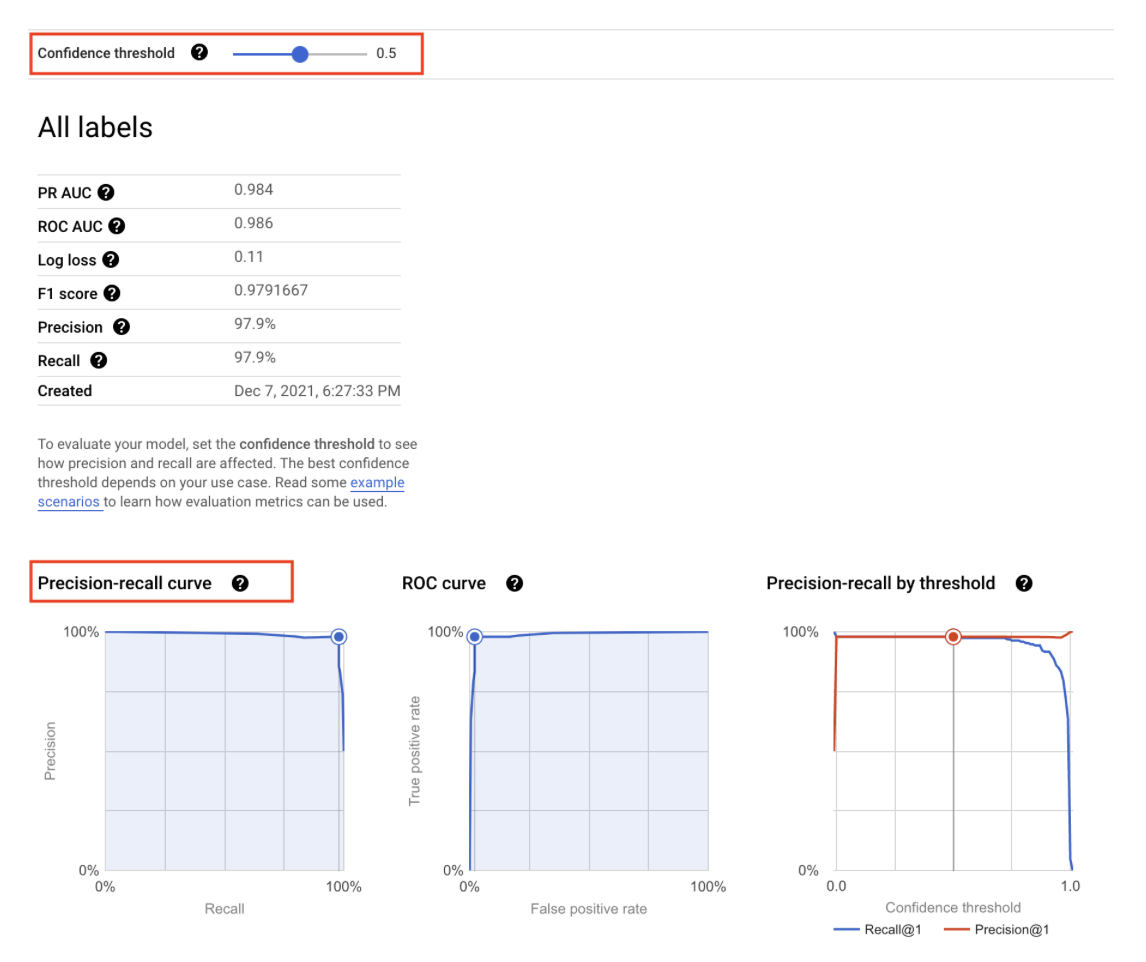
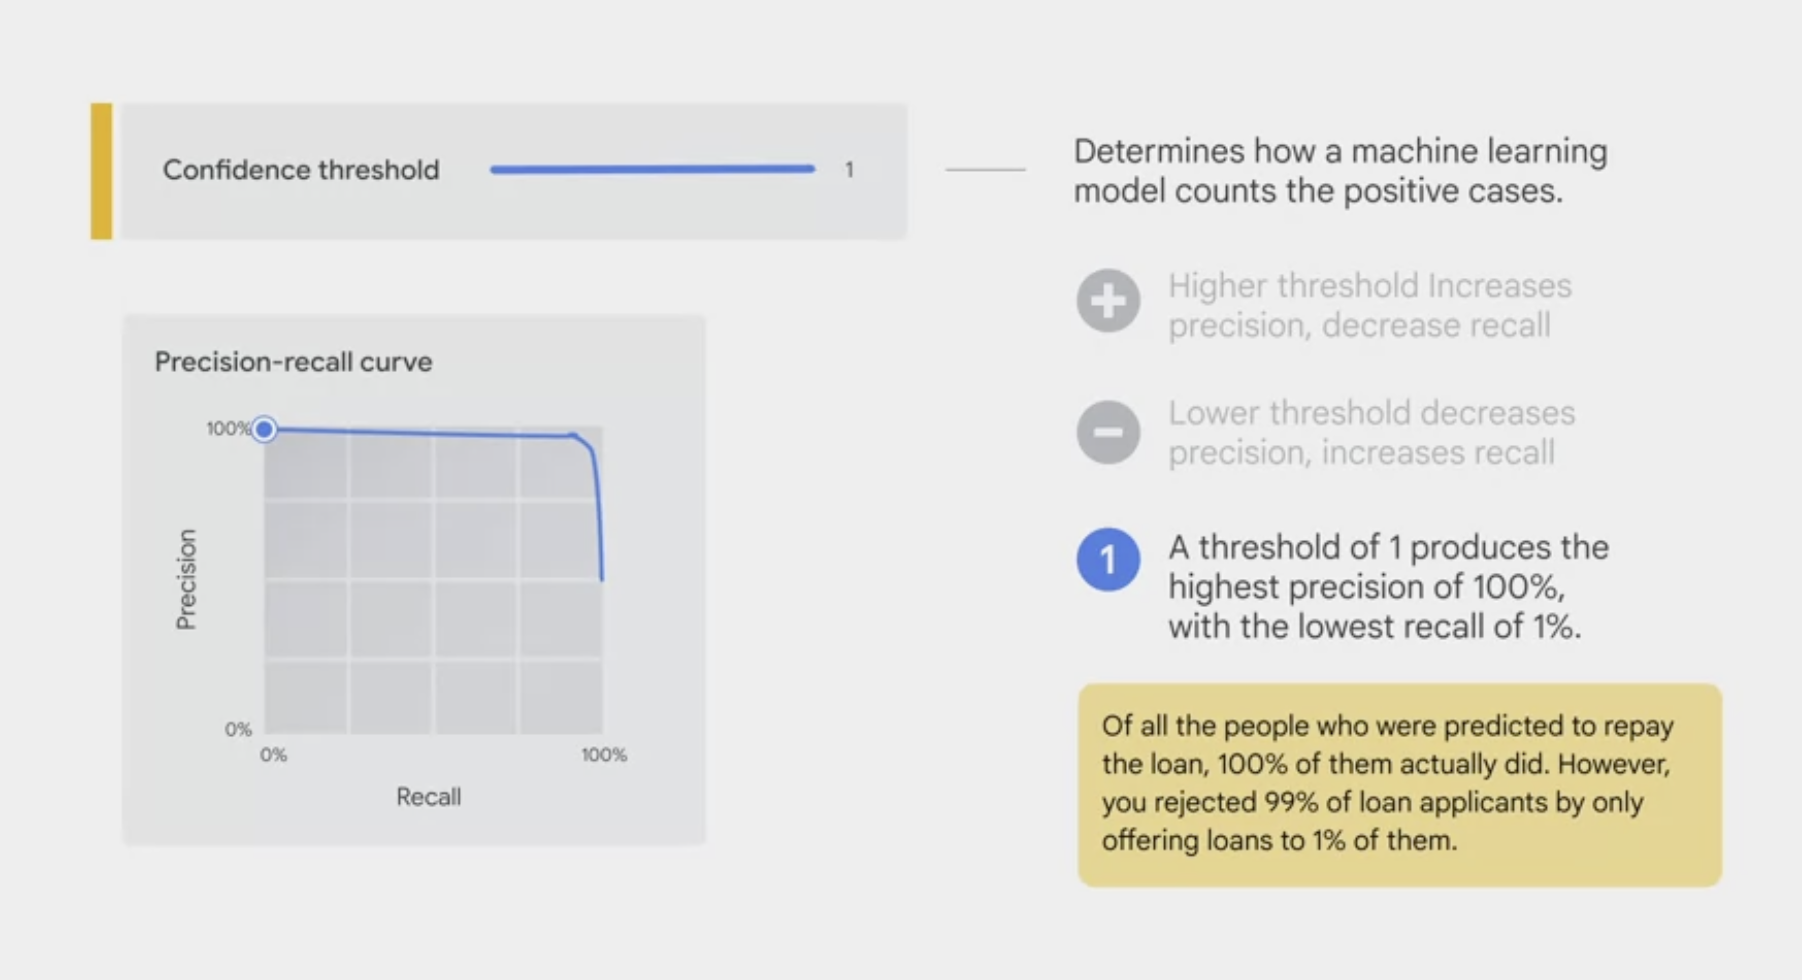
Precision/Recall curve
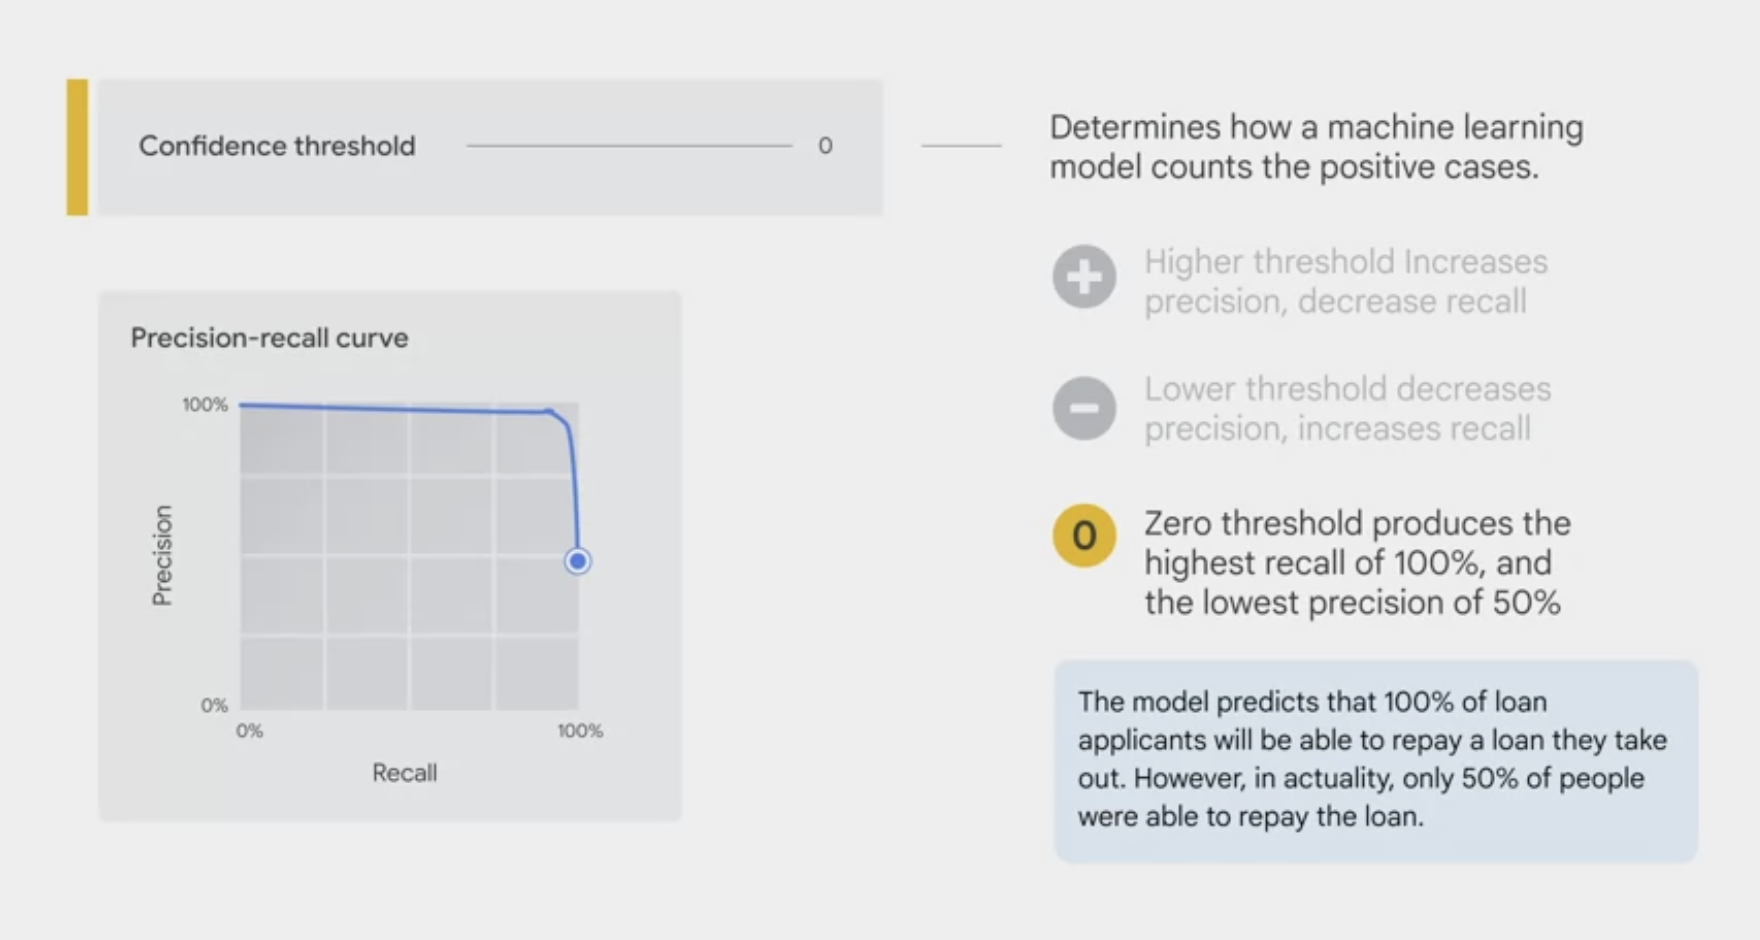
- The
confidence thresholddetermines how a ML model counts the positive cases. - A higher threshold increases the precision, but decreases recall.
A lower threshold decreases the precision, but increases recall.
- You can manually adjust the threshold to observe its impact on precision and recall and find the best tradeoff point between the two to meet the business needs.
confusion metrix
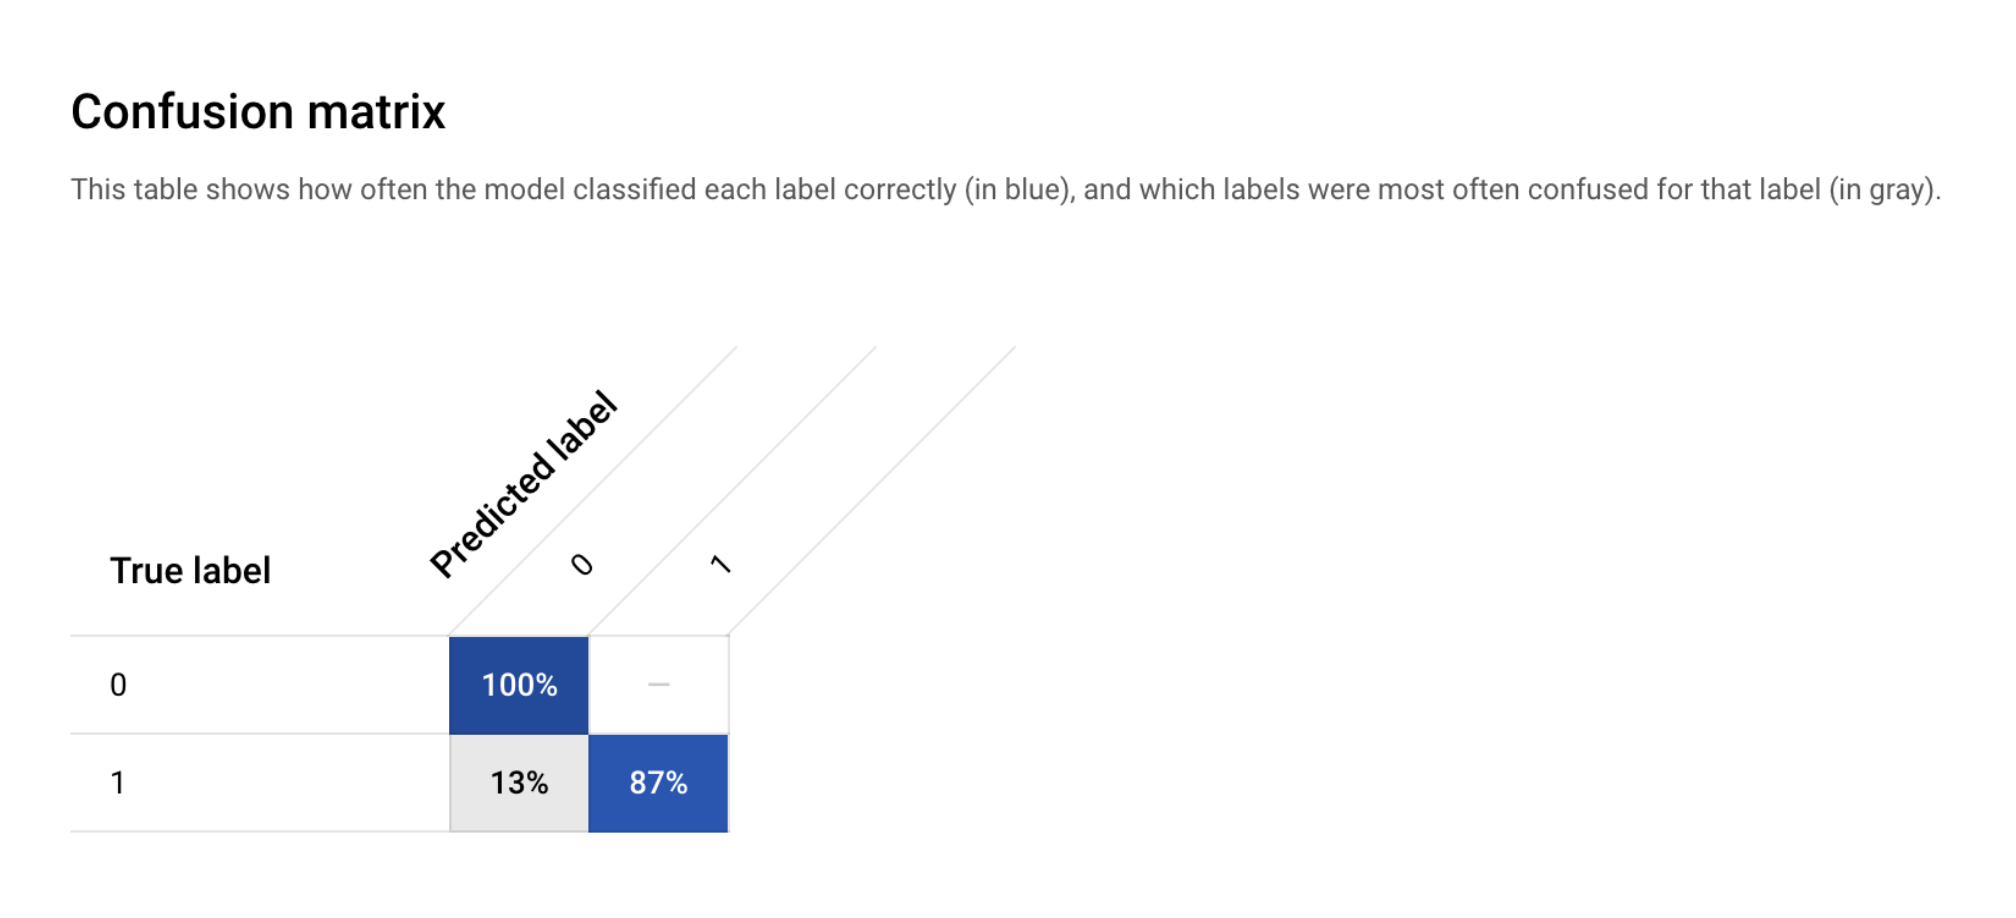
confusion matrix
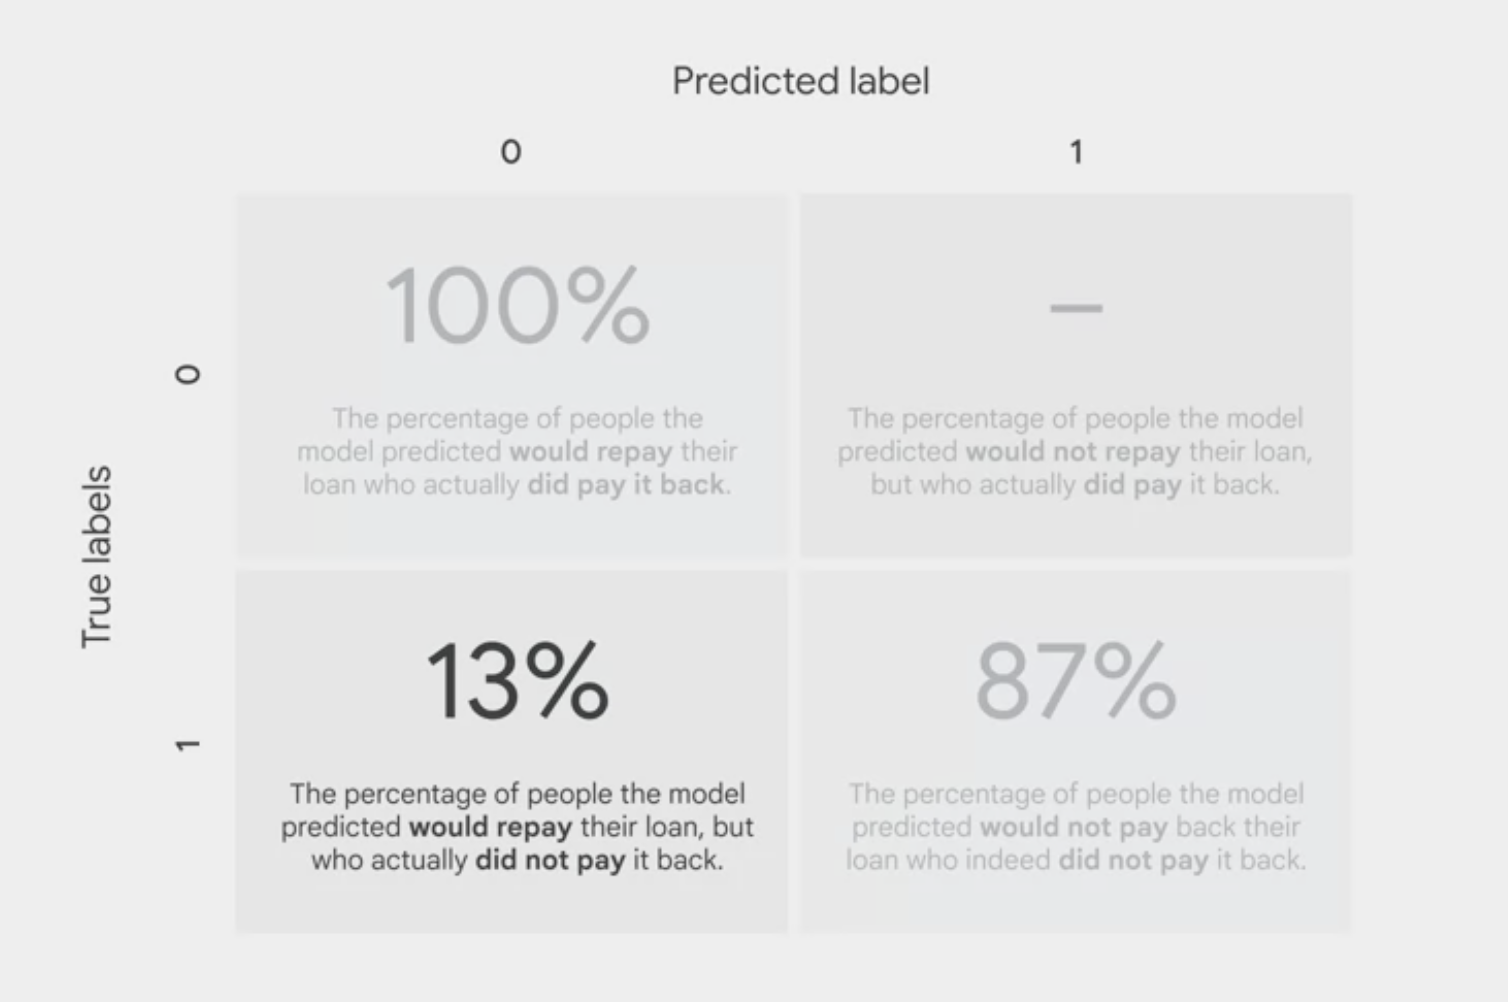
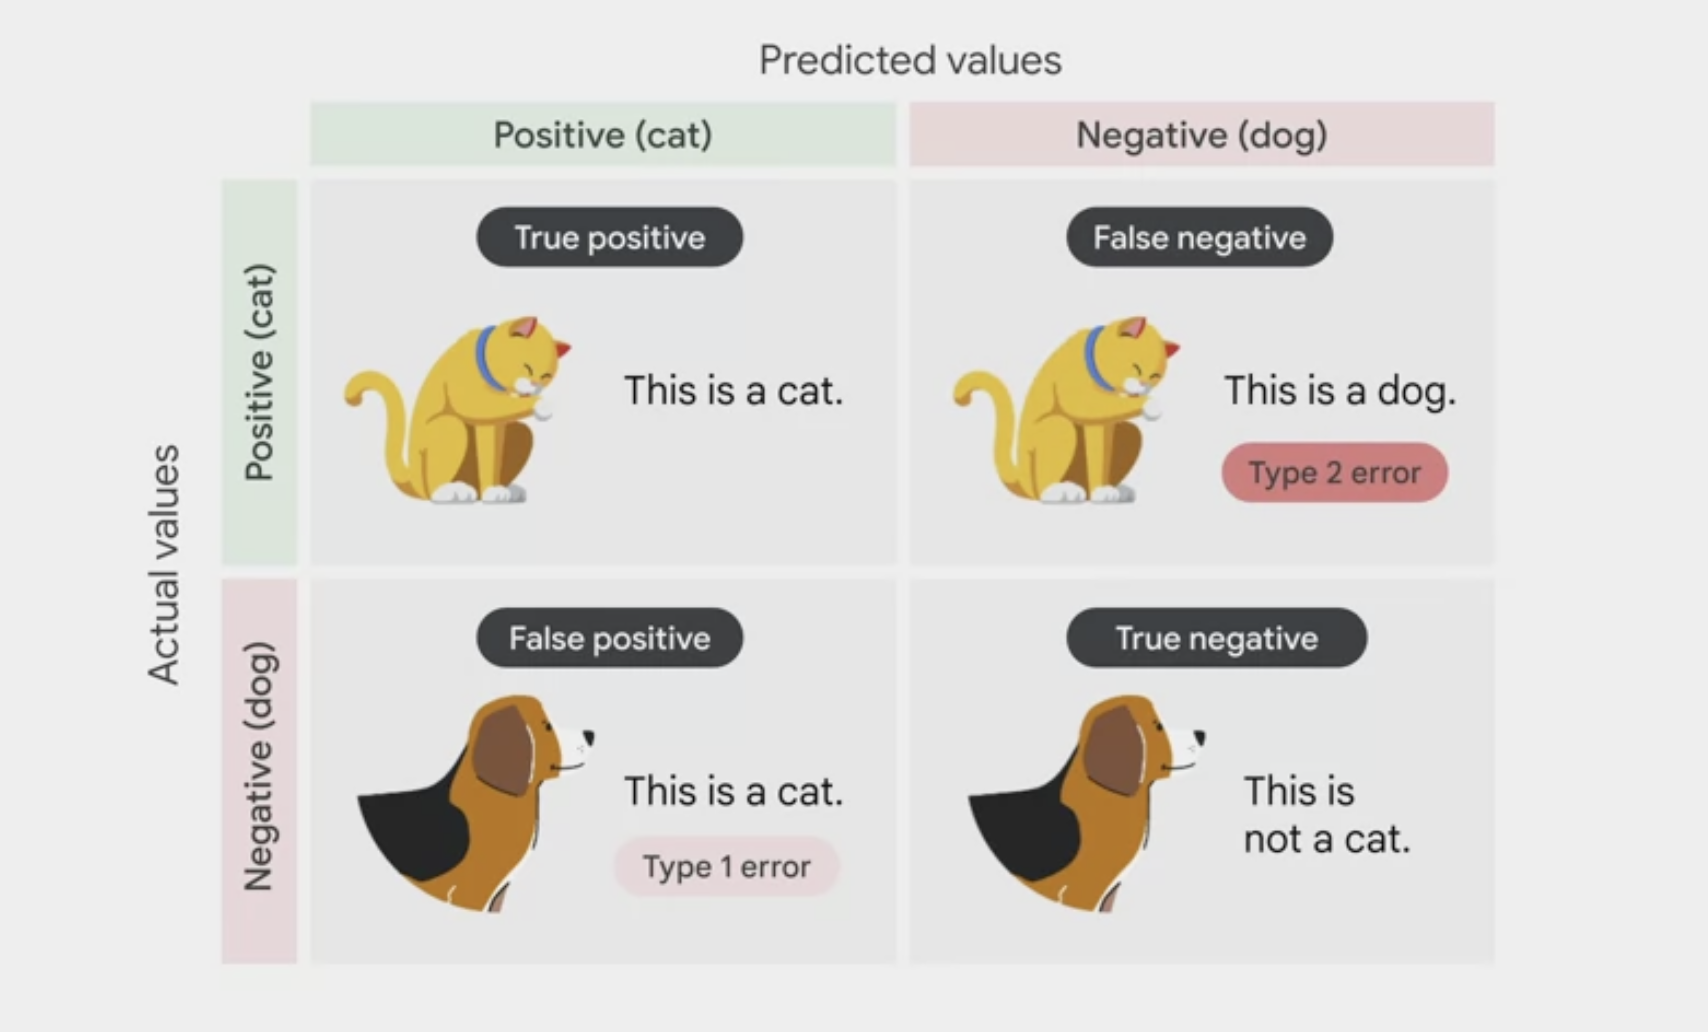
- tells the percentage of examples from each class in the test set that the model predicted correctly.
Confusion matrix table
displaying
true labelandpredicted labelclassificationsThe confusion matrix shows that the initial model is able to predict 100% of the repay examples and 87% of the default examples in the test set correctly, which is not too bad.
You can improve the percentage by adding more examples (more data), engineering new features, and changing the training method, etc.
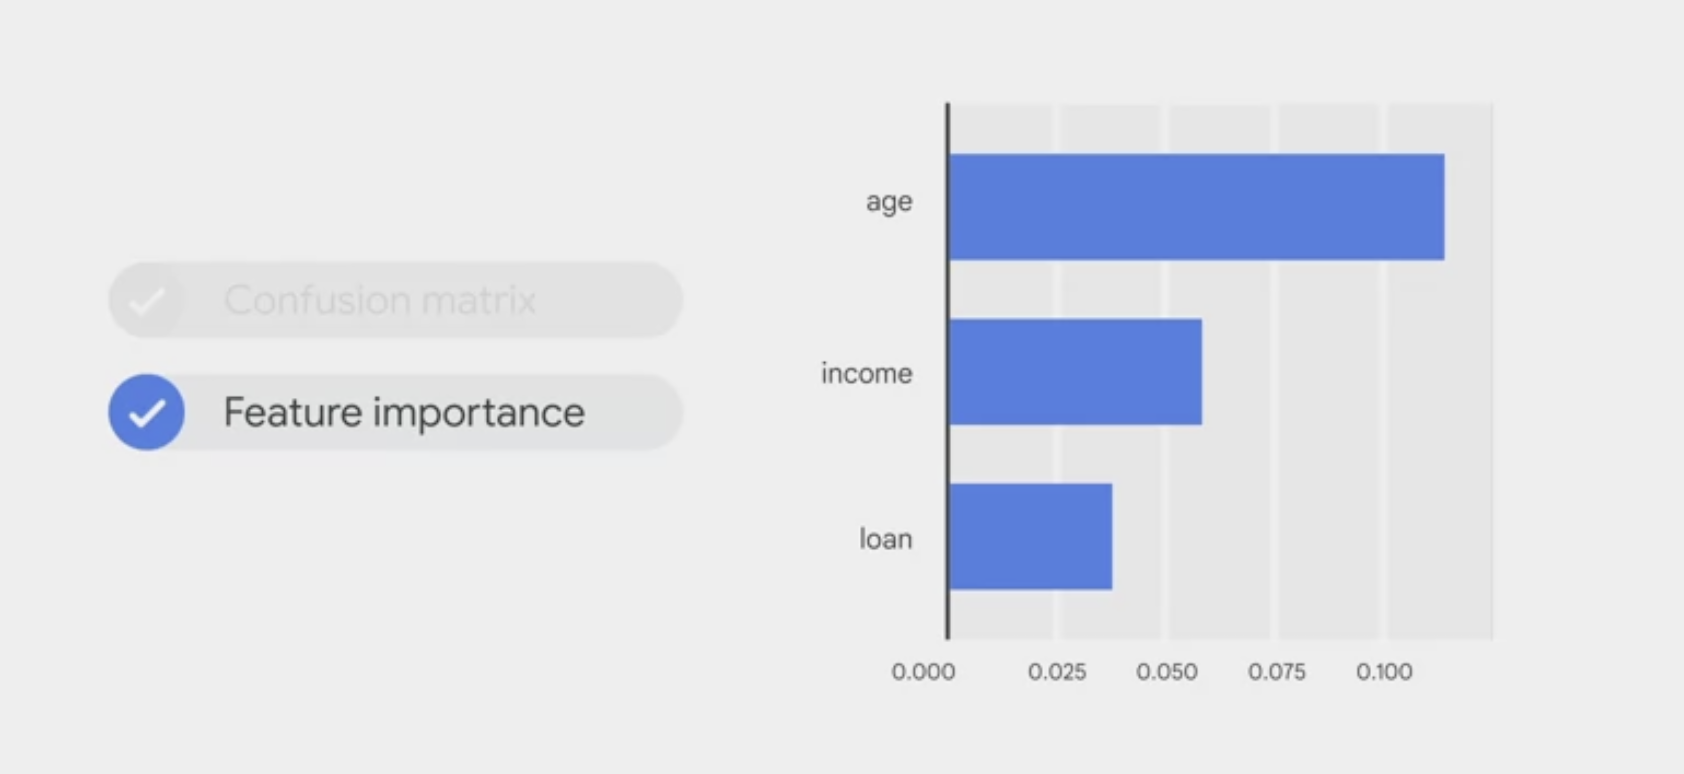
Feature importance
In Vertex AI, feature importance is displayed through a bar chart to illustrate
how each feature contributes to a prediction.The longer the bar, or the larger the numerical value associated with a feature, the more important it is.
- These feature importance values could be used to improve the model and have more confidence in its predictions.
- You might decide to remove the least important features next time you train a model or to combine two of the more significant features into a feature cross to see if this improves model performance.
- Feature importance is just one example of Vertex AI’s comprehensive machine learning functionality called Explainable AI. Explainable AI is a set of tools and frameworks to help understand and interpret predictions made by machine learning models.
Feature importance bar chart for loan, income, and age
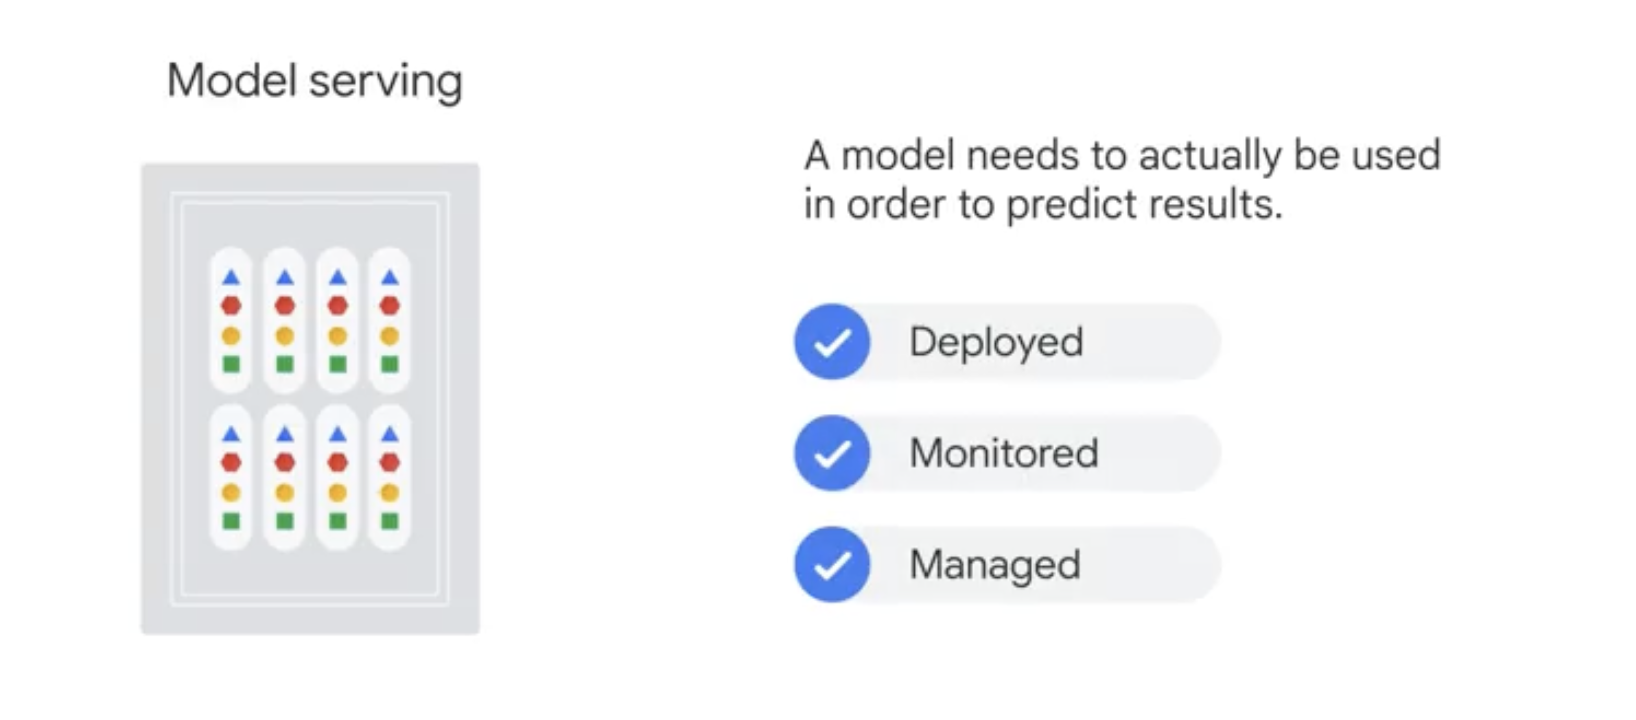
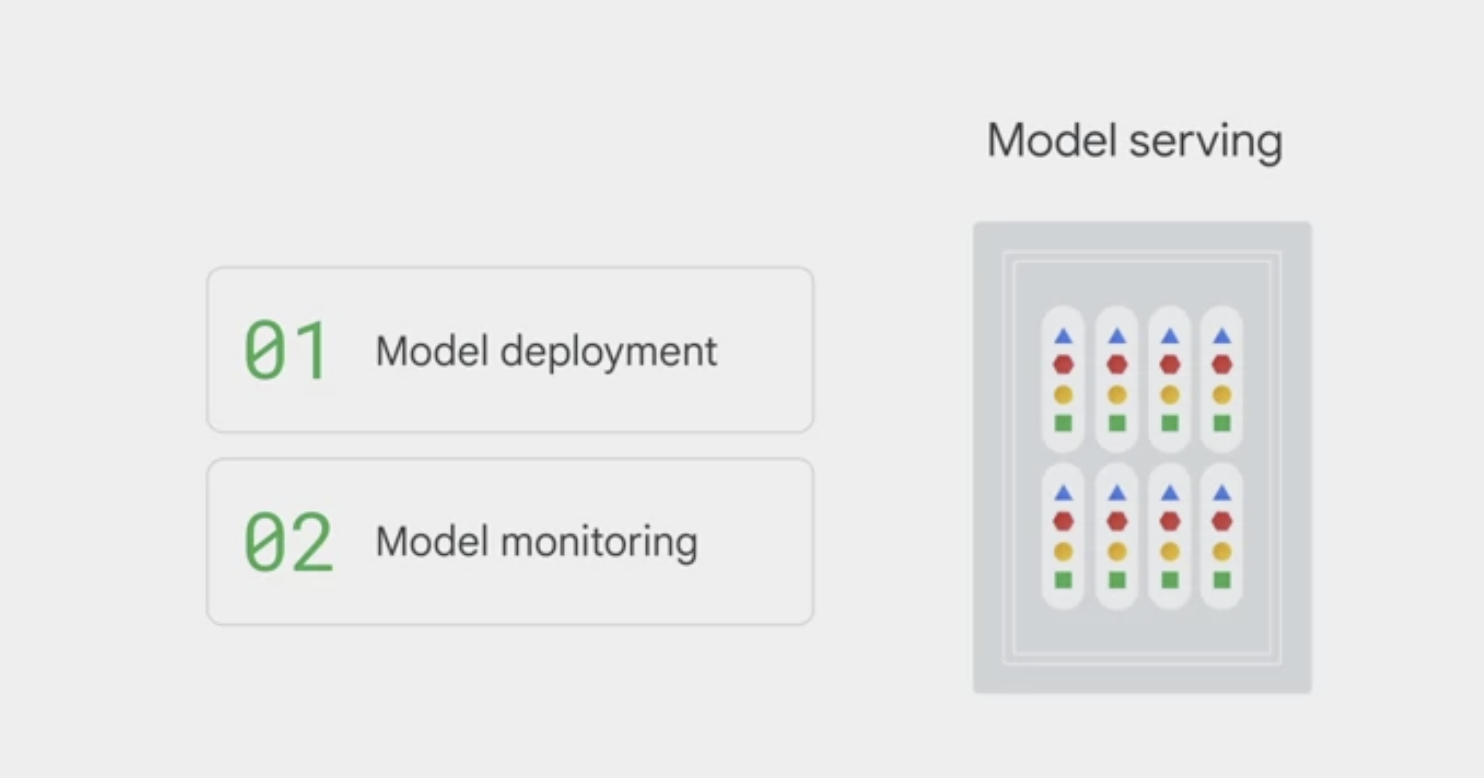
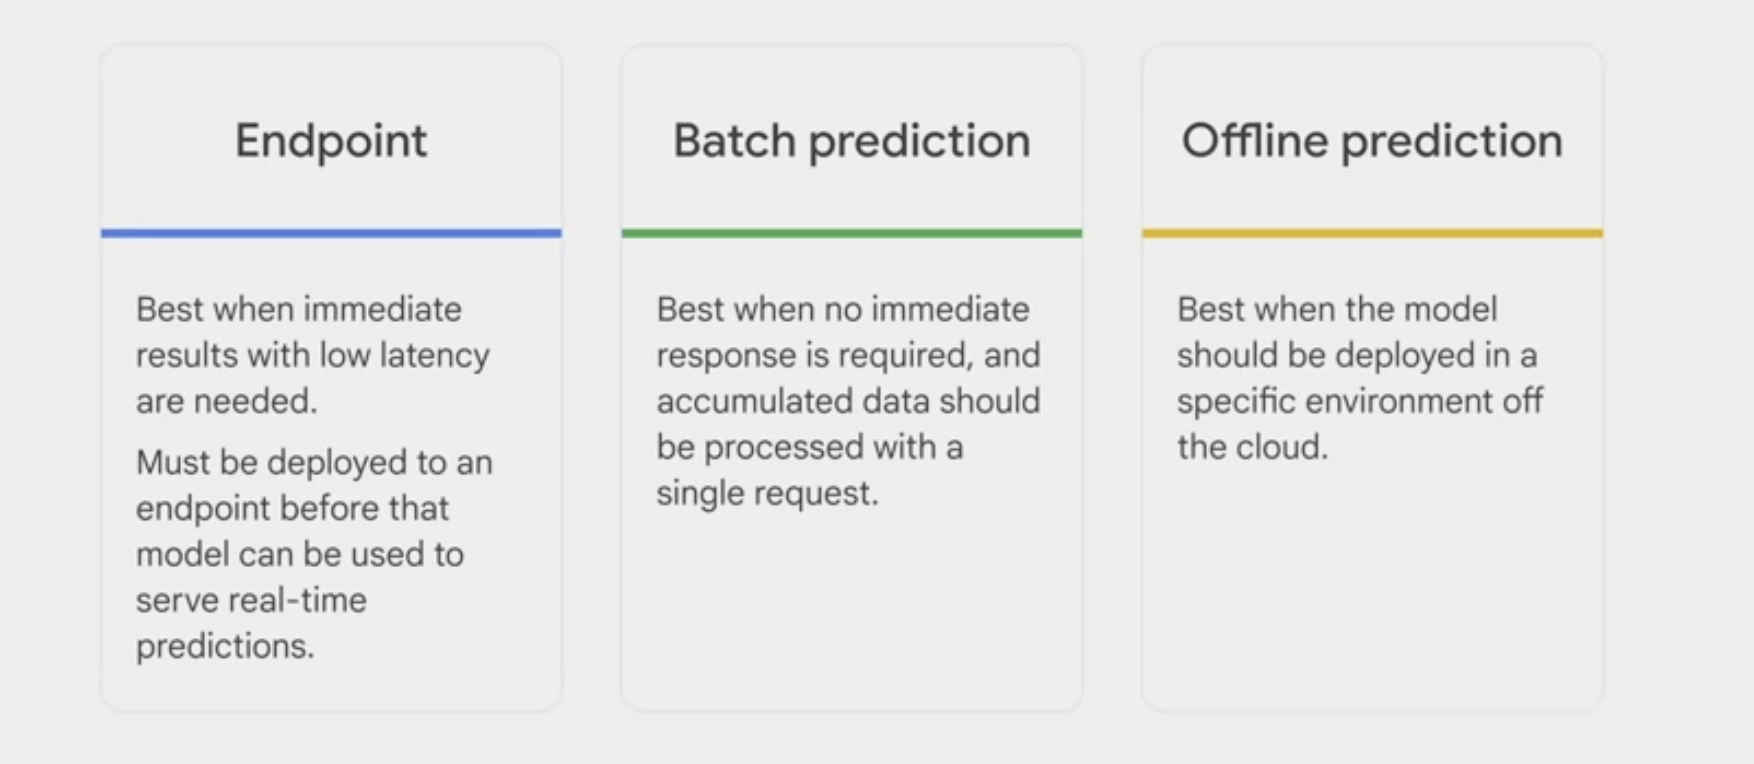
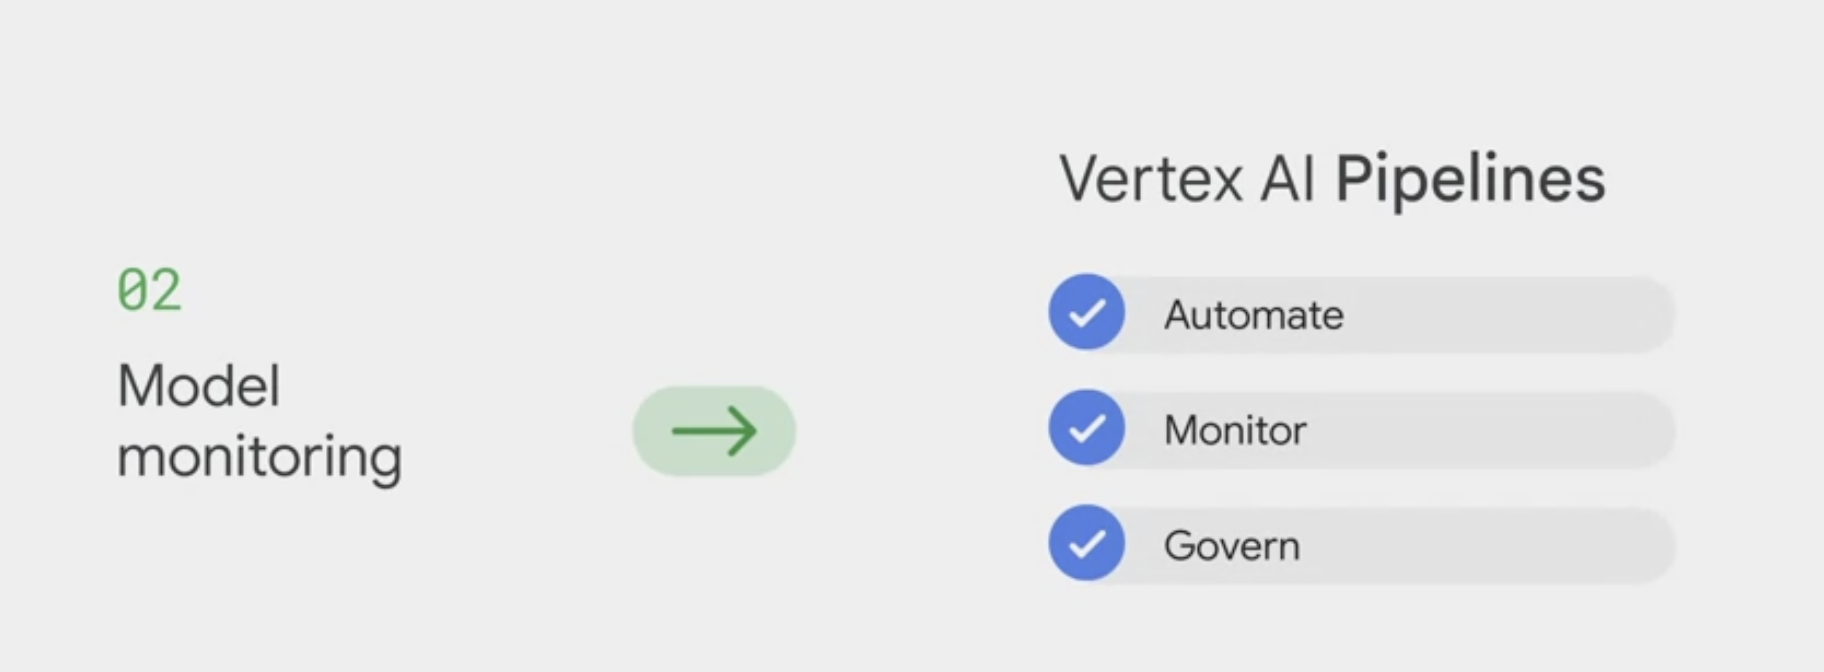
Model deployment and monitoring
.


Comments powered by Disqus.