AI - MLOps in GCP
MLOps in GCP
- MLOps in GCP
- Best practices for implementing machine learning on Google Cloud
[ ML environment Description Choose this environment if…](#-ml-environment————————description——————————————————————————————————————————————————————————————————————————————-choose-this-environment-if) - MLOps: Continuous delivery and automation pipelines in machine learning
- What’s next
- Contributors
Best practices for implementing machine learning on Google Cloud
high-level overview of the stages in the ML workflow addressed in this document including related products:
- ML environment
- ML development
- Prepare training data.
- Store structured and semi-structured data in BigQuery.
- Store image, video, audio and unstructured data on Cloud Storage.
- Use Vertex AI Feature Store with structured data.
- Use Vertex AI TensorBoard and Vertex AI Experiments for analyzing experiments.
- Train a model within a Vertex AI Workbench instance for small datasets.
- Maximize the model’s predictive accuracy with hyperparameter tuning.
- Use a Vertex AI Workbench instance to understand the models.
- Use feature attributions to gain insights into model predictions
- Data preparation
- ML training
- Model deployment and serving
- ML workflow orchestration
- Artifact organization
- Model monitoring
Best practices
ML environment
| ML environment | Description | Choose this environment if…
1
                                                                                                ###  ###                    ###                                                                                        | ||------------------|-----------------| | BigQuery ML                          | ML brings together data, infrastructure, and predefined model types into a single system.                                                                                                                                                           | - All data is contained in BigQuery.- comfortable with SQL. <br   1.  The set of [models available in BigQuery ML](https://docs.cloud.google.com/bigquery/docs/reference/standard-sql/bigqueryml-syntax-create#model_type).                                                                                                                                                                               | | AutoML (in the context of Vertex AI) | provides training routines for common problems like image classification and tabular regression. (Nearly all aspects of training and serving a model, like choosing an architecture, hyperparameter tuning, and provisioning machines, are handled). | - data and problem match one of the formats with data types and model objectives that AutoML supports. The model can be served from Google Cloud or deployed to an external device. <br   1.  For text, video, or tabular models, model can tolerate inference latencies > 100ms. can also train AutoML tabular models from the [BigQuery ML](https://docs.cloud.google.com/bigquery-ml/docs) environment. | | Vertex AI custom trained models      | run own custom training routines and deploy models of any type on serverless architecture. Vertex AI offers additional services, like hyperparameter tuning and monitoring, to make it easier to develop a model.                                   | - the problem does not match the criteria listed in this table for BigQuery ML or AutoML.                                                                                                                                                                                                                                                                                                                  |
- Use Vertex AI Workbench instances for experimentation and development
- use Vertex AI Workbench instances for experimentation and development, including writing code, starting jobs, running queries, and checking status.
it can access all of Google Cloud’s data and AI services in a simple, reproducible way.
it give the a secure set of software and access patterns. It is a common practice to customize Google Cloud properties like network and IAM, and software (through a container) associated with a Vertex AI Workbench instance.
- or use Colab Enterprise, which is a collaborative managed notebook environment that uses the security and compliance capabilities of Google Cloud.
- Create a Vertex AI Workbench instance for each team member
- Create a Vertex AI Workbench instance for each member of the data science team.
- for multiple projects, especially projects that have different dependencies, using multiple instances, treating each instance as a virtual workspace.
- stop Vertex AI Workbench instances when they are not being used.
- Store the ML resources and artifacts based on the corporate policy
- The simplest access control is to store both the raw and Vertex AI resources and artifacts, such as datasets and models, in the same Google Cloud project.
- More typically, the corporation has policies that control access. In cases where the resources and artifacts are stored across projects, configure the corporate cross-project access control with IAM.
- Use Vertex AI SDK for Python
- a Pythonic way to use Vertex AI for the end-to-end model building workflows, which works seamlessly with the ML frameworks including PyTorch, TensorFlow, XGBoost, and scikit-learn.
- Alternatively, use the Google Cloud console, which supports the functionality of Vertex AI as a user interface through the browser.
ML development
ML development addresses preparing the data, experimenting, and evaluating the model.
When solving a ML problem, it is typically necessary to build and compare many different models to figure out what works best.
- data scientists train models using different architectures, input data sets, hyperparameters, and hardware.
- Data scientists evaluate the resulting models by looking at
aggregate performancemetrics likeaccuracy, precision, and recallon test datasets. - Data scientists evaluate the performance of the models against particular subsets of their data, different model versions, and different model architectures.
Data preparation
Prepare training data
The data used to train a model can originate from any number of systems, for example, logs from an online service system, images from a local device, or documents scraped from the web.
Regardless of the data’s origin, extract data from the source systems and
convert to the format and storage (separate from the operational source) optimized for ML training.
Data Storage
Store structured and semi-structured data
BigQuery- with
structured or semi-structured data, store all data in BigQuery.- Use BigQuery for storing unprocessed structured or semi-structured data.
- If the’re building the model using BigQuery ML, use the transformations built into BigQuery for preprocessing data.
- If the’re using AutoML, use the transformations built into AutoML for preprocessing data.
- If the’re building a custom model, using the BigQuery transformations may be the most cost-effective method.
- For large datasets, consider using partitioning in BigQuery. This practice can improve query performance and cost efficiency.
- Use BigQuery for storing unprocessed structured or semi-structured data.
In most cases, store
intermediate, processed datain BigQuery as well.For maximum speed, it’s better to store materialized data instead of using views or subqueries for training data.
- Read data out of BigQuery using the BigQuery Storage API. For artifact tracking, consider using a managed tabular dataset. The following table lists Google Cloud tools that make it easier to use the API:
- with
1
2
3
4
5
6
7
8
9
10
11
12
13
14
15
16
17
18
19
20
        | If
        ---
         | the're using...                                                 | Use this Google Cloud t### ool      ###                                                                                                      |
         |-----------------------------------------------------------------|----------------------------------------------------------------------------------------------------------------------------------------------|
         | TensorFlow for Keras                                            | [tf.data.dataset reader for BigQuery](https://towardsdatascience.com/how-to-read-bigquery-data-from-tensorflow-2-0-efficiently-9234b69165c8) |
         | TFX                                                             | [BigQuery client](https://www.tensorflow.org/io/tutorials/bigquery)                                                                          |
         | Dataflow                                                        | [Google BigQuery I/O Connector](https://beam.apache.org/documentation/io/built-in/google-bigquery/)                                          |
         | Any other framework (such as PyTorch, XGBoost, or scikit-learn) | [Importing models in BigQuery](https://docs.cloud.google.com/bigquery/docs/reference/standard-sql/bigqueryml-syntax-create-onnx)             |

  2. **Store image, video, audio and unstructured data on Cloud Storage**

     1. Store these data in large container formats on Cloud Storage.
        1. sharded TFRecord files when using TensorFlow
        2. Avro files when using any other framework.

     2. Combine many individual images, videos, or audio clips into large files
        1. this improve the read and write throughput to Cloud Storage.
        2. Aim for files of at least 100mb, and between 100 and 10,000 shards.

     3. To enable data management, use Cloud Storage buckets and directories to group the shards.
- Use data labeling services with the Google Cloud console
- create and import training data through the Vertex AI page.
- By using the prompt and tuning capabilities of Gemini, manage text data with customized classification, entity extraction, and sentiment analysis.
- There are also data labeling solutions on the Google Cloud console Marketplace, such as Labelboxand Snorkel Flow.
- Use Vertex AI Feature Store with structured data
- use Vertex AI Feature Store to create, maintain, share, and serve ML features in a central location.
- It’s optimized to serve workloads that need low latency, and lets the store feature data in a BigQuery table or view.
- To use Vertex AI Feature Store, must create an online store instance and define the feature views. BigQuery stores all the feature data, including historical feature data to allow the to work offline.
To process data
Dataflow- With large volumes of data, using Dataflow, which uses the Apache Beam programming model.
- use Dataflow to
convert the unstructured data into binary data formatslike TFRecord, which can improve performance of data ingestion during the training process.
Serverless Spark data processing
DataprocUse one-off Python scripts for smaller datasets that fit into memory.
to perform transformations that are not expressible in Cloud SQL or are for streaming, the can use a combination of Dataflow and the pandas library.
Use managed datasets with ML metadata
After data is pre-processed for ML, using a managed dataset in Vertex AI to create a clear link between the data and custom-trained models, and provide descriptive statistics and automatic or manual splitting into train, test, and validation sets.
Managed datasets are not required; not to use them if want more control over splitting the data in the training code, or if lineage between the data and model isn’t critical to the application.
Use Vertex AI TensorBoard and Vertex AI Experiments for analyzing experiments
- When developing models, use Vertex AI TensorBoard to visualize and compare specific experiments—for example, based on hyperparameters. Vertex AI TensorBoard is an enterprise-ready managed service with a cost-effective, secure solution that lets data scientists and ML researchers collaborate by making it seamless to
track, compare, and share their experiments. Vertex AI TensorBoard enables tracking experiment metrics like loss and accuracy over time, visualizing the model graph, projecting embeddings to a lower dimensional space, and much more.
- Use Vertex AI Experiments to integrate with Vertex ML Metadata and to log and build linkage across parameters, metrics, and dataset and model artifacts.
- When developing models, use Vertex AI TensorBoard to visualize and compare specific experiments—for example, based on hyperparameters. Vertex AI TensorBoard is an enterprise-ready managed service with a cost-effective, secure solution that lets data scientists and ML researchers collaborate by making it seamless to
Train model via Vertex AI Workbench instance for small datasets
- Training model in the Vertex AI Workbench instance may be sufficient for small datasets, or subsets of a larger dataset.
- It may be helpful to use the training service for larger datasets or for distributed training. Using the Vertex AI training service is also recommended to productionize training even on small datasets if the training is carried out on a schedule or in response to the arrival of additional data.
To Maximize the model’s predictive accuracy
hyperparameter tuning- hyperparameter tuning: the automated model enhancer provided by the Vertex AI training service which takes advantage of the processing infrastructure of Google Cloud and Vertex AI Vizier to test different hyperparameter configurations when training the model.
- removes the need to manually adjust hyperparameters over the course of numerous training runs to arrive at the optimal values.
To understand the models
Vertex AI Workbench instance- Use Vertex AI Workbench instance to evaluate and understand the models.
- In addition to built-in common libraries like scikit-learn, Vertex AI Workbench instances include the
- What-if Tool (WIT): lets the interactively analyze the models for bias using multiple techniques
- Language Interpretability Tool (LIT): helps the understand natural language processing model behavior through a visual, interactive, and extensible tool.
To gain insights into model predictions
Vertex Explainable AI feature attributions- Vertex Explainable AI is an integral part of the ML implementation process, offering feature attributions to provide insights into why models generate predictions.
- By detailing the importance of each feature that a model uses as input to make a prediction, Vertex Explainable AI helps the better understand the model’s behavior and build trust in the models.
- Vertex Explainable AI supports custom-trained models based on tabular and image data.
ML training
operationalized training
- the process of making model training repeatable by
tracking repetitions, andmanaging performance. - Vertex AI Workbench instances are convenient for iterative development on small datasets
- operationalize the code to make it reproducible and able to scale to large datasets.
Run the code in a managed service
- run the code in Vertex AI training service or orchestrate with Vertex AI Pipelines.
- run the code directly in Deep Learning VM Images, Deep Learning Containers, or Compute Engine.
- However, advise against this approach if the are using features of Vertex AI such as automatic scaling and burst capability.
Operationalize job execution with training pipelines
To operationalize training job execution on Vertex AI
- create training pipelines.
- A training pipeline, which is different from a general ML pipeline, encapsulates training jobs.
Use training checkpoints to save the current state of the experiment
The ML workflow in this document assumes that the’re not training interactively.
If the model fails and isn’t checkpointed, the training job or pipeline will finish and the data will be lost because the model isn’t in memory. To prevent this scenario, make it a practice to always use training checkpoints to ensure the don’t lose state.
We recommend that the save training checkpoints in Cloud Storage. Create a different folder for each experiment or training run.
Prepare model artifacts for serving in Cloud Storage
For custom-trained models or custom containers, store the model artifacts in a Cloud Storage bucket, where the bucket’s region matches the regional endpoint the’re using for production.
- object versioning: to provide a mitigation against accidental data loss or corruption, enable object versioning in Cloud Storage.
- Store the Cloud Storage bucket in the same Google Cloud project. If the Cloud Storage bucket is in a different Google Cloud project, grant Vertex AI access to read the model artifacts.
Use a Vertex AI prebuilt container, ensure that the model artifacts have filenames that exactly match these examples:
- TensorFlow SavedModel:
saved_model.pb - Scikit-learn:
model.joblib - XGBoost:
model.bst - PyTorch:
model.pth
Regularly compute new feature values
Often, a model will use a subset of features sourced from Vertex AI Feature Store.
- The features in Vertex AI Feature Store will already be ready for online serving.
- For any new features created by data scientist by sourcing data from the data lake, we recommend scheduling the corresponding data processing and feature engineering jobs (or ideally Dataflow) to regularly compute the new feature values at the required cadence, depending upon feature freshness needs, and ingesting them into Vertex AI Feature Store for online or batch serving.
Model deployment and serving
Model deployment and serving
- refers to putting a model into production.
- The output of the training job is one or more model artifacts stored on Cloud Storage, which the can upload to Model Registry so the file can be used for prediction serving.
2 types of prediction serving:
- batch prediction is used to score batches of data at a regular cadence
- online prediction is used for near real-time scoring of data for live applications.
- Both approaches let the obtain predictions from trained models by passing input data to a cloud-hosted ML model and getting inferences for each data instance.
Vertex AI private endpoints
- To lower latency for peer-to-peer requests between the client and the model server
- particularly useful if the
applicationthat makes the prediction requests and theserving binaryare within the same local network, avoid the overhead of internet routing and make a peer-to-peer connection using Virtual Private Cloud
Specify the number and types of machines needed
- To deploy the model for prediction, choose hardware that is appropriate for the model, like different central processing unit (CPU) virtual machine (VM) types or graphics processing unit (GPU) types.
- Specifying machine types or scale tiers.
Plan inputs to the model
- determine how to pass inputs to the model.
- batch prediction: fetch data from the data lake, or from the Vertex AI Feature Store batch serving API.
- online prediction: send input instances to the service and it returns the predictions in the response.
- Response body details.
Deploying the model for online prediction
- need a low latency, scalable way to serve the inputs or features that need to be passed to the model’s endpoint.
- either do this by
- using one of the many Database services on Google Cloud,
- or use Vertex AI Feature Store’s online serving API.
- The clients calling the online prediction endpoint can first call the feature serving solution to fetch the feature inputs, and then call the prediction endpoint with those inputs.
- the can serve multiple models to the same endpoint, for example, to gradually replace the model.
- the can deploy models to multiple endpoints,for example, in testing and production, by sharing resources across deployments.
Streaming ingestion lets the make real-time updates to feature values.
- useful when having the latest available data for online serving is a priority.
- For example, the can ingest streaming event data and, within a few seconds, Vertex AI Feature Store streaming ingestion makes that data available for online serving scenarios.
- customize the input (request) and output (response) handling and format to and from the model server
Turn on automatic scaling
- for online prediction service, recommend turn on automatic scaling by setting minimum and maximum nodes.
- Get predictions for a custom trained model.
- To ensure a high availability service level agreement (SLA), set automatic scaling with a minimum of two nodes.
- scaling options: Scaling ML predictions.
ML workflow orchestration
ML workflow orchestration
- Vertex AI provides
ML workflow orchestrationto automate the ML workflow with Vertex AI Pipelines, a fully managed service that lets the retrain the models as often as necessary. - retraining enables the models to adapt to changes and maintain performance over time
- but consider how much the data will change when choosing the optimal model retraining cadence.
- work best designed and built model, put it into production, and want to determine what is and isn’t working in the ML model.
- The code the use for experimentation will likely be useful for the rest of the ML workflow with some modification.
- To work with automated ML workflows, the need to be fluent in Python, understand basic infrastructure like containers, and have ML and data science knowledge.
To orchestrate the ML workflow Vertex AI Pipelines
- manually start each data process, training, evaluation, test, and deployment
- or useVertex AI Pipelines to orchestrate the flow.
- MLOps level 1: ML pipeline automation.
- Vertex AI Pipelines supports running DAGs generated by Kubeflow, TensorFlow Extended (TFX), and Airflow.
To flexible pipeline construction Kubeflow Pipelines
- use Kubeflow Pipelines SDK to author managed pipelines.
- Kubeflow Pipelines is flexible, use code to construct pipelines.
- It also provides Google Cloud pipeline components, to include Vertex AI functionality like AutoML in the pipeline.
- Kubeflow Pipelines
- Vertex AI Pipelines
Use Ray on Vertex AI for distributed ML workflows
Ray
- provides a general and unified distributed framework to scale machine learning workflows through a Python open-source, scalable, and distributed computing framework.
- solve the challenges that come from having a variety of distributed frameworks in the ML ecosystem, such as having to deal with multiple modes of task parallelism, scheduling, and resource management.
- Ray on Vertex AI to develop applications on Vertex AI.
Artifact organization
Artifacts
- outputs resulting from each step in the ML workflow. It’s a best practice to organize them in a standardized way.
Organize the ML model artifacts
Store the artifacts in these locations:
[Storage location: Artifacts]
- Source control repository
- Vertex AI Workbench instances
- Pipeline source code
- Preprocessing Functions
- Model source code
- Model training packages
- Serving functions
- Experiments and ML metadata
- Experiments
- Parameters
- Hyperparameters
- Metaparameters
- Metrics
- Dataset artifacts
- Model artifacts
- Pipeline metadata
- Model Registry
- Trained models
- Artifact Registry
- Pipeline containers
- Custom training environments
- Custom prediction environments
- Vertex AI Inference
- Deployed models
Use a source control repository for pipeline definitions and training code
- use
source controlto version control the ML pipelines and the custom components build for those pipelines. - use Artifact Registry to store, manage, and secure the Docker container images without making them publicly visible.
Model monitoring
Once deploy the model into production, monitor performance to ensure that the model is performing as expected.
- Model monitoring works for structured data, like numerical and categorical features,
- but not for unstructured data, like images.
Vertex AI provides 2 ways to monitor the ML models:
Skew detection: looks for the degree of distortion between the model training and production dataDrift detection: looking for drift in the production data.- Drift occurs when the statistical properties of the inputs and the target, which the model is trying to predict, change over time in unforeseen ways.
- This causes problems because the predictions could become less accurate as time passes.
- Monitoring models for feature skew or drift.
Use skew and drift detection
For skew detection
- use skew detection because knowing that the production data has deviated from the training data is a
strong indicator that the model isn't performing as expectedin production - set up the model monitoring job by providing a pointer to the training data that the used to train the model.
- If the don’t have access to the training data, turn on drift detection so that the’ll know when the inputs change over time.
drift detection
- Use drift detection to monitor whether the production data is deviating over time.
- enable the features the want to monitor and the corresponding thresholds to trigger an alert.
Fine tune alert thresholds
- Tune the thresholds used for alerting so the know when skew or drift occurs in the data.
- Alert thresholds are determined by the use case, the user’s domain expertise, and by initial model monitoring metrics.
- to create dashboards or configure alerts based on the metrics: Cloud monitoring metrics.
Use feature attributions to detect data drift or skew
- use feature attributions in Vertex Explainable AI to detect data drift or skew as an early indicator that model performance may be degrading.
For example, if the model originally relied on five features to make predictions in the training and test data, but the model began to rely on entirely different features when it went into production, feature attributions would help the detect this degradation in model performance.
the can use feature attributions to detect model degradation regardless of the type of feature the model takes as input.
- particularly useful for complex feature types, like embeddings and time series, which are difficult to compare using traditional skew and drift methods. With Vertex Explainable AI, feature attributions can indicate when model performance is degrading.
Use BigQuery to support model monitoring
- a set of tools and functionalities that helps the track and evaluate the performance of the ML models over time.
Model monitoring is essential for maintaining model accuracy and reliability in real-world applications, recommend monitor for the following issues:
Data skew: This issue happens when feature value distributions differ between training and serving data. Training statistics, which are saved during model training, enable skew detection without needing the original data.
Data drift: Real-world data often changes over time. Model monitoring helps the identify when the input data that the model sees in production (serving data) starts to differ significantly from the data that it was trained on (training data). This drift can lead to degraded performance.
Advanced data skew or drift: When the want fine-grained skew or drift statistics, monitor for advanced data skew or drift.
MLOps: Continuous delivery and automation pipelines in machine learning
continuous integration (CI), continuous delivery (CD), and continuous training (CT) for machine learning (ML) systems.
Data science and ML are becoming core capabilities for solving complex real-world problems, transforming industries, and delivering value in all domains. Currently, the ingredients for applying effective ML are available to the:
- Large datasets
- Inexpensive on-demand compute resources
- Specialized accelerators for ML on various cloud platforms
- Rapid advances in different ML research fields (such as computer vision, natural language understanding, generative AI, and recommendations AI systems).
MLOps
- apply DevOps principles to ML systems (MLOps)
- an ML engineering culture and practice that aims at unifying ML system development (Dev) and ML system operation (Ops).
Practicing MLOps means that the
advocate for automation and monitoringat all steps of ML system construction, including integration, testing, releasing, deployment and infrastructure management.- implement and train an ML model with predictive performance on an offline holdout dataset, given relevant training data for their use case.
- the challenge is
building an integrated ML systemand tocontinuously operate itin production.
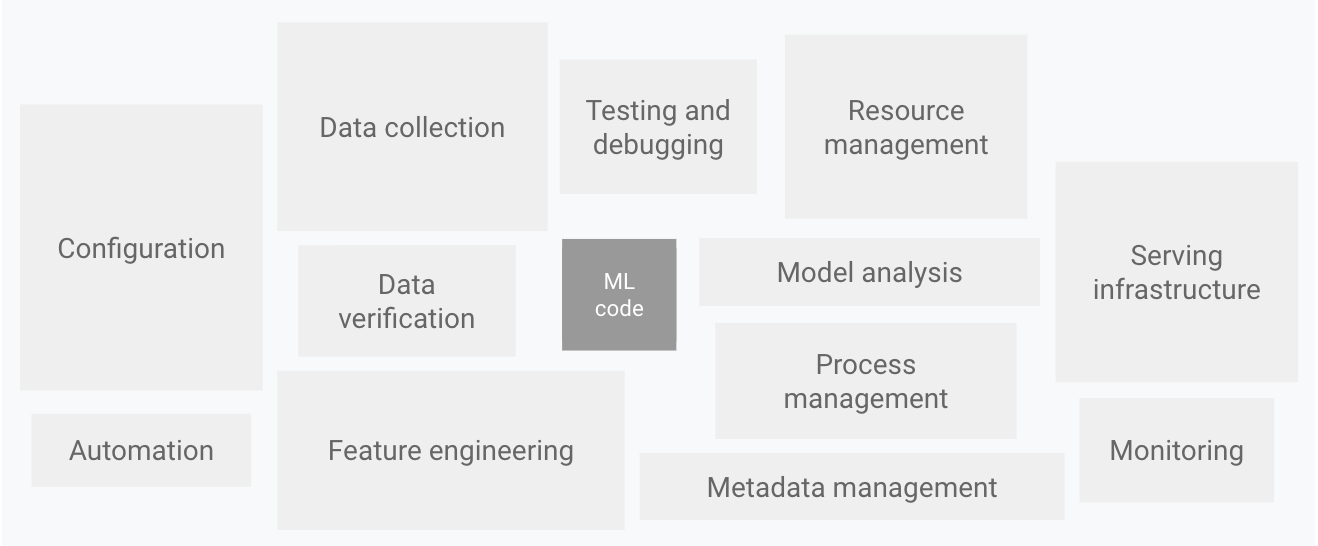
only a small fraction of a real-world ML system is composed of the ML code. The required surrounding elements are vast and complex. Elements for ML systems. Adapted from Hidden Technical Debt in Machine Learning Systems.
The preceding diagram displays the following system components:
- Configuration
- Automation
- Data collection
- Data verification
- Testing and debugging
- Resource management
- Model analysis
- Process and metadata management
- Serving infrastructure
- Monitoring
DevOps versus MLOps
a popular practice in
developing and operating large-scale software systems.- This practice provides benefits such as
- shortening the development cycles,
- increasing deployment velocity, and dependable releases.
- To achieve these benefits, the introduce two concepts in the software system development:
- An ML system is a software system
- similar practices apply to help guarantee that the can reliably build and operate ML systems at scale.
However, ML systems differ from other software systems in the following ways:
Team skills: In an ML project, the team usually includes data scientists or ML researchers, who focus on exploratory data analysis, model development, and experimentation. These members might not be experienced software engineers who can
build production-class services.Development: ML is experimental in nature. try different features, algorithms, modeling techniques, and parameter configurations to find what works best for the problem as quickly as possible. The challenge is
tracking what worked and what didn't, andmaintaining reproducibility while maximizing code reusability.Testing: Testing an ML system is more involved than testing other software systems. In addition to typical unit and integration tests, need data validation, trained model quality evaluation, and model validation.
Deployment: In ML systems, deployment isn’t as simple as deploying an offline-trained ML model as a prediction service. ML systems can require the to deploy a multi-step pipeline to automatically retrain and deploy models. This pipeline adds complexity and requires the to automate steps that are manually done before deployment by data scientists to train and validate new models.
Production: ML models can have reduced performance due to suboptimal coding, constantly evolving data profiles. models can decay in more ways than conventional software systems, and the need to consider this degradation. Therefore, need to track summary statistics of ther data and monitor the online performance of the model to send notifications or roll back when values deviate from ther expectations.
ML and other software systems are similar in continuous integration of source control, unit testing, integration testing, and continuous delivery of the software module or the package. However, in ML, there are a few notable differences:
- CI is no longer only about testing and validating code and components, but also
testing and validating data, data schemas, and models. - CD is no longer about a single software package or a service, but
a system (an ML training pipeline) that should automatically deploy another service(model prediction service). - CT is a new property, unique to ML systems, that’s concerned with
automatically retraining and serving the models.
Data science steps for ML
In any ML project
define the business use caseandestablish the success criteria- delivering an ML model to production (involves the following steps)
These steps can be completed manually or can be completed by an automatic pipeline.
- Data extraction: the select and integrate the relevant data from various data sources for the ML task.
- Data analysis: the perform exploratory data analysis (EDA) to understand the available data for building the ML model. This process leads to the following:
- Understanding the data schema and characteristics that are expected by the model.
- Identifying the data preparation and feature engineering that are needed for the model.
- Data preparation: The data is prepared for the ML task. This preparation involves data cleaning, where the split the data into training, validation, and test sets. the also apply data transformations and feature engineering to the model that solves the target task. The output of this step are the data splits in the prepared format.
- Model training: The data scientist implements different algorithms with the prepared data to train various ML models. In addition, the subject the implemented algorithms to hyperparameter tuning to get the best performing ML model. The output of this step is a trained model.
- Model evaluation: The model is evaluated on a holdout test set to evaluate the model quality. The output of this step is a set of metrics to assess the quality of the model.
- Model validation: The model is confirmed to be adequate for deployment—that its predictive performance is better than a certain baseline.
- Model serving: The validated model is deployed to a target environment to serve predictions. This deployment can be one of the following:
- Microservices with a REST API to serve online predictions.
- An embedded model to an edge or mobile device.
- Part of a batch prediction system.
- Model monitoring: The model predictive performance is monitored to potentially invoke a new iteration in the ML process.
The level of automation of these steps defines the maturity of the ML process, which reflects the velocity of training new models given new data or training new models given new implementations. The following sections describe three levels of MLOps, starting from the most common level, which involves no automation, up to automating both ML and CI/CD pipelines.
MLOps level 0: Manual process
Many teams have data scientists and ML researchers who can build state-of-the-art models, but their process for building and deploying ML models is entirely manual. This is considered the basic level of maturity, or level 0. The following diagram shows the workflow of this process.

Figure 2. Manual ML steps to serve the model as a prediction service.
Characteristics
The following list highlights the characteristics of the MLOps level 0 process, as shown in Figure 2:
Manual, script-driven, and interactive process: Every step is manual, including data analysis, data preparation, model training, and validation. It requires manual execution of each step, and manual transition from one step to another. This process is usually driven by experimental code that is interactively written and executed in notebooks by data scientists, until a workable model is produced.
Disconnection between ML and operations: The process separates data scientists who create the model and engineers who serve the model as a prediction service. The data scientists hand over a trained model as an artifact to the engineering team to deploy on their API infrastructure. This handoff can include putting the trained model in a storage location, checking the model object into a code repository, or uploading it to a models registry. Then engineers who deploy the model need to make the required features available in production for low-latency serving, which can lead to training-serving skew.
Infrequent release iterations: The process assumes that ther data science team manages a few models that don’t change frequently—either changing model implementation or retraining the model with new data. A new model version is deployed only a couple of times per year.
No CI: Because few implementation changes are assumed, CI is ignored. Usually, testing the code is part of the notebooks or script execution. The scripts and notebooks that implement the experiment steps are source controlled, and they produce artifacts such as trained models, evaluation metrics, and visualizations.
No CD: Because there aren’t frequent model version deployments, CD isn’t considered.
Deployment refers to the prediction service: The process is concerned only with deploying the trained model as a prediction service (for example, a microservice with a REST API), rather than deploying the entire ML system.
Lack of active performance monitoring: The process doesn’t track or log the model predictions and actions, which are required in order to detect model performance degradation and other model behavioral drifts.
The engineering team might have their own complex setup for API configuration, testing, and deployment, including security, regression, and load and canary testing. In addition, production deployment of a new version of an ML model usually goes through A/B testing or online experiments before the model is promoted to serve all the prediction request traffic.
Challenges
MLOps level 0 is common in many businesses that are beginning to apply ML to their use cases. This manual, data-scientist-driven process might be sufficient when models are rarely changed or trained. In practice, models often break when they are deployed in the real world. The models fail to adapt to changes in the dynamics of the environment, or changes in the data that describes the environment. For more information, see Why Machine Learning Models Crash and Burn in Production.
To address these challenges and to maintain ther model’s accuracy in production, the need to do the following:
Actively monitor the quality of ther model in production: Monitoring lets the detect performance degradation and model staleness. It acts as a cue to a new experimentation iteration and (manual) retraining of the model on new data.
Frequently retrain ther production models: To capture the evolving and emerging patterns, the need to retrain ther model with the most recent data. For example, if ther app recommends fashion products using ML, its recommendations should adapt to the latest trends and products.
Continuously experiment with new implementations to produce the model: To harness the latest ideas and advances in technology, the need to try out new implementations such as feature engineering, model architecture, and hyperparameters. For example, if the use computer vision in face detection, face patterns are fixed, but better new techniques can improve the detection accuracy.
To address the challenges of this manual process, MLOps practices for CI/CD and CT are helpful. By deploying an ML training pipeline, the can enable CT, and the can set up a CI/CD system to rapidly test, build, and deploy new implementations of the ML pipeline. These features are discussed in more detail in the next sections.
MLOps level 1: ML pipeline automation
The goal of level 1 is to perform continuous training of the model by automating the ML pipeline; this lets the achieve continuous delivery of model prediction service. To automate the process of using new data to retrain models in production, the need to introduce automated data and model validation steps to the pipeline, as well as pipeline triggers and metadata management.
The following figure is a schematic representation of an automated ML pipeline for CT.

Figure 3. ML pipeline automation for CT.
Characteristics
The following list highlights the characteristics of the MLOps level 1 setup, as shown in Figure 3:
Rapid experiment: The steps of the ML experiment are orchestrated. The transition between steps is automated, which leads to rapid iteration of experiments and better readiness to move the whole pipeline to production.
CT of the model in production: The model is automatically trained in production using fresh data based on live pipeline triggers, which are discussed in the next section.
Experimental-operational symmetry: The pipeline implementation that is used in the development or experiment environment is used in the preproduction and production environment, which is a key aspect of MLOps practice for unifying DevOps.
Modularized code for components and pipelines: To construct ML pipelines, components need to be reusable, composable, and potentially shareable across ML pipelines. Therefore, while the EDA code can still live in notebooks, the source code for components must be modularized. In addition, components should ideally be containerized to do the following:
- Decouple the execution environment from the custom code runtime.
- Make code reproducible between development and production environments.
- Isolate each component in the pipeline. Components can have their own version of the runtime environment, and have different languages and libraries.
Continuous delivery of models: An ML pipeline in production continuously delivers prediction services to new models that are trained on new data. The model deployment step, which serves the trained and validated model as a prediction service for online predictions, is automated.
Pipeline deployment: In level 0, the deploy a trained model as a prediction service to production. For level 1, the deploy a whole training pipeline, which automatically and recurrently runs to serve the trained model as the prediction service.
Additional components
This section discusses the components that the need to add to the architecture to enable ML continuous training.
Data and model validation
When the deploy ther ML pipeline to production, one or more of the triggers discussed in the ML pipeline triggerssection automatically executes the pipeline. The pipeline expects new, live data to produce a new model version that is trained on the new data (as shown in Figure 3). Therefore, automated data validation and model validation steps are required in the production pipeline to ensure the following expected behavior:
Data validation: This step is required before model training to decide whether the should retrain the model or stop the execution of the pipeline. This decision is automatically made if the following was identified by the pipeline.
- Data schema skews: These skews are considered anomalies in the input data. Therefore, input data that doesn’t comply with the expected schema is received by the downstream pipeline steps, including the data processing and model training steps. In this case, the should stop the pipeline so the data science team can investigate. The team might release a fix or an update to the pipeline to handle these changes in the schema. Schema skews include receiving unexpected features, not receiving all the expected features, or receiving features with unexpected values.
- Data values skews: These skews are significant changes in the statistical properties of data, which means that data patterns are changing, and the need to trigger a retraining of the model to capture these changes.
Model validation: This step occurs after the successfully train the model given the new data. the evaluate and validate the model before it’s promoted to production. This offline model validation step consists of the following.
- Producing evaluation metric values using the trained model on a test dataset to assess the model’s predictive quality.
- Comparing the evaluation metric values produced by ther newly trained model to the current model, for example, production model, baseline model, or other business-requirement models. the make sure that the new model produces better performance than the current model before promoting it to production.
- Making sure that the performance of the model is consistent on various segments of the data. For example, ther newly trained customer churn model might produce an overall better predictive accuracy compared to the previous model, but the accuracy values per customer region might have large variance.
- Making sure that the test ther model for deployment, including infrastructure compatibility and consistency with the prediction service API.
In addition to offline model validation, a newly deployed model undergoes online model validation—in a canary deployment or an A/B testing setup—before it serves prediction for the online traffic.
Feature store
An optional additional component for level 1 ML pipeline automation is a feature store. A feature store is a centralized repository where the standardize the definition, storage, and access of features for training and serving. A feature store needs to provide an API for both high-throughput batch serving and low-latency real-time serving for the feature values, and to support both training and serving workloads.
The feature store helps data scientists do the following:
- Discover and reuse available feature sets for their entities, instead of re-creating the same or similar ones.
- Avoid having similar features that have different definitions by maintaining features and their related metadata.
- Serve up-to-date feature values from the feature store.
Avoid training-serving skew by using the feature store as the data source for experimentation, continuous training, and online serving. This approach makes sure that the features used for training are the same ones used during serving:
- For experimentation, data scientists can get an offline extract from the feature store to run their experiments.
- For continuous training, the automated ML training pipeline can fetch a batch of the up-to-date feature values of the dataset that are used for the training task.
- For online prediction, the prediction service can fetch in a batch of the feature values related to the requested entity, such as customer demographic features, product features, and current session aggregation features.
- For online prediction and feature retrieval, the prediction service identifies the relevant features for an entity. For example, if the entity is a customer, relevant features might include age, purchase history, and browsing behavior. The service batches these feature values together and retrieves all the needed features for the entity at once, rather than individually. This retrieval method helps with efficiency, especially when the need to manage multiple entities.
Metadata management
Information about each execution of the ML pipeline is recorded in order to help with data and artifacts lineage, reproducibility, and comparisons. It also helps the debug errors and anomalies. Each time the execute the pipeline, the ML metadata store records the following metadata:
- The pipeline and component versions that were executed.
- The start and end date, time, and how long the pipeline took to complete each of the steps.
- The executor of the pipeline.
- The parameter arguments that were passed to the pipeline.
- The pointers to the artifacts produced by each step of the pipeline, such as the location of prepared data, validation anomalies, computed statistics, and extracted vocabulary from the categorical features. Tracking these intermediate outputs helps the resume the pipeline from the most recent step if the pipeline stopped due to a failed step, without having to re-execute the steps that have already completed.
- A pointer to the previous trained model if the need to roll back to a previous model version or if the need to produce evaluation metrics for a previous model version when the pipeline is given new test data during the model validation step.
- The model evaluation metrics produced during the model evaluation step for both the training and the testing sets. These metrics help the compare the performance of a newly trained model to the recorded performance of the previous model during the model validation step.
ML pipeline triggers
the can automate the ML production pipelines to retrain the models with new data, depending on ther use case:
- On demand: Ad hoc manual execution of the pipeline.
- On a schedule: New, labeled data is systematically available for the ML system on a daily, weekly, or monthly basis. The retraining frequency also depends on how frequently the data patterns change, and how expensive it is to retrain ther models.
- On availability of new training data: New data isn’t systematically available for the ML system and instead is available on an ad hoc basis when new data is collected and made available in the source databases.
- On model performance degradation: The model is retrained when there is noticeable performance degradation.
- On significant changes in the data distributions (concept drift). It’s hard to assess the complete performance of the online model, but the notice significant changes on the data distributions of the features that are used to perform the prediction. These changes suggest that ther model has gone stale, and that needs to be retrained on fresh data.
Challenges
Assuming that new implementations of the pipeline aren’t frequently deployed and the are managing only a few pipelines, the usually manually test the pipeline and its components. In addition, the manually deploy new pipeline implementations. the also submit the tested source code for the pipeline to the IT team to deploy to the target environment. This setup is suitable when the deploy new models based on new data, rather than based on new ML ideas.
However, the need to try new ML ideas and rapidly deploy new implementations of the ML components. If the manage many ML pipelines in production, the need a CI/CD setup to automate the build, test, and deployment of ML pipelines.
MLOps level 2: CI/CD pipeline automation
–
For a rapid and reliable update of the pipelines in production, the need a robust automated CI/CD system. This automated CI/CD system lets ther data scientists rapidly explore new ideas around feature engineering, model architecture, and hyperparameters. They can implement these ideas and automatically build, test, and deploy the new pipeline components to the target environment.
The following diagram shows the implementation of the ML pipeline using CI/CD, which has the characteristics of the automated ML pipelines setup plus the automated CI/CD routines.

Figure 4. CI/CD and automated ML pipeline.
This MLOps setup includes the following components:
- Source control
- Test and build services
- Deployment services
- Model registry
- Feature store
- ML metadata store
- ML pipeline orchestrator
Characteristics
The following diagram shows the stages of the ML CI/CD automation pipeline:

Figure 5. Stages of the CI/CD automated ML pipeline.
The pipeline consists of the following stages:
Development and experimentation: the iteratively try out new ML algorithms and new modeling where the experiment steps are orchestrated. The output of this stage is the source code of the ML pipeline steps that are then pushed to a source repository.
Pipeline continuous integration: the build source code and run various tests. The outputs of this stage are pipeline components (packages, executables, and artifacts) to be deployed in a later stage.
Pipeline continuous delivery: the deploy the artifacts produced by the CI stage to the target environment. The output of this stage is a deployed pipeline with the new implementation of the model.
Automated triggering: The pipeline is automatically executed in production based on a schedule or in response to a trigger. The output of this stage is a trained model that is pushed to the model registry.
Model continuous delivery: the serve the trained model as a prediction service for the predictions. The output of this stage is a deployed model prediction service.
Monitoring: the collect statistics on the model performance based on live data. The output of this stage is a trigger to execute the pipeline or to execute a new experiment cycle.
The data analysis step is still a manual process for data scientists before the pipeline starts a new iteration of the experiment. The model analysis step is also a manual process.
Continuous integration
In this setup, the pipeline and its components are built, tested, and packaged when new code is committed or pushed to the source code repository. Besides building packages, container images, and executables, the CI process can include the following tests:
Unit testing ther feature engineering logic.
Unit testing the different methods implemented in ther model. For example, the have a function that accepts a categorical data column and the encode the function as a one-hot feature.
Testing that ther model training converges (that is, the loss of ther model goes down by iterations and overfits a few sample records).
Testing that ther model training doesn’t produce NaN values due to dividing by zero or manipulating small or large values.
Testing that each component in the pipeline produces the expected artifacts.
Testing integration between pipeline components.
Continuous delivery
In this level, ther system continuously delivers new pipeline implementations to the target environment that in turn delivers prediction services of the newly trained model. For rapid and reliable continuous delivery of pipelines and models, the should consider the following:
Verifying the compatibility of the model with the target infrastructure before the deploy ther model. For example, the need to verify that the packages that are required by the model are installed in the serving environment, and that the required memory, compute, and accelerator resources are available.
Testing the prediction service by calling the service API with the expected inputs, and making sure that the get the response that the expect. This test usually captures problems that might occur when the update the model version and it expects a different input.
Testing prediction service performance, which involves load testing the service to capture metrics such as queries per second (QPS) and model latency.
Validating the data either for retraining or batch prediction.
Verifying that models meet the predictive performance targets before they are deployed.
Automated deployment to a test environment, for example, a deployment that is triggered by pushing code to the development branch.
Semi-automated deployment to a pre-production environment, for example, a deployment that is triggered by merging code to the main branch after reviewers approve the changes.
Manual deployment to a production environment after several successful runs of the pipeline on the pre-production environment.
To summarize, implementing ML in a production environment doesn’t only mean deploying ther model as an API for prediction. Rather, it means deploying an ML pipeline that can automate the retraining and deployment of new models. Setting up a CI/CD system lets the automatically test and deploy new pipeline implementations. This system lets the cope with rapid changes in ther data and business environment. the don’t have to immediately move all of ther processes from one level to another. the can gradually implement these practices to help improve the automation of ther ML system development and production.
What’s next
- Learn more about Architecture for MLOps using TensorFlow Extended, Vertex AI Pipelines, and Cloud Build.
- Learn about the Practitioners Guide to Machine Learning Operations (MLOps).
- Watch the MLOps Best Practices on Google Cloud (Cloud Next ‘19) on theTube.
- For an overview of architectural principles and recommendations that are specific to AI and ML workloads in Google Cloud, see the AI and ML perspective in the Well-Architected Framework.
- For more reference architectures, diagrams, and best practices, explore the Cloud Architecture Center.
Contributors
Authors:
Jarek Kazmierczak Solutions Architect Khalid Salama Staff Software Engineer, Machine Learning Valentin Huerta AI Engineer
| Other contributor: Sunil Kumar Jang Bahadur | Customer Engineer |
Was this helpful?
Send feedback
Except as otherwise noted, the content of this page is licensed under the Creative Commons Attribution 4.0 License, and code samples are licensed under the Apache 2.0 License. For details, see the Google Developers Site Policies. Java is a registered trademark of Oracle and/or its affiliates.
Last updated 2024-08-28 UTC.
Products and pricing
Support
Resources
Engage
- About Google
- Privacy
- Site terms
- Google Cloud terms
- Our third decade of climate action: join us
- Sign up for the Google Cloud newsletterSubscribe
English .
Comments powered by Disqus.